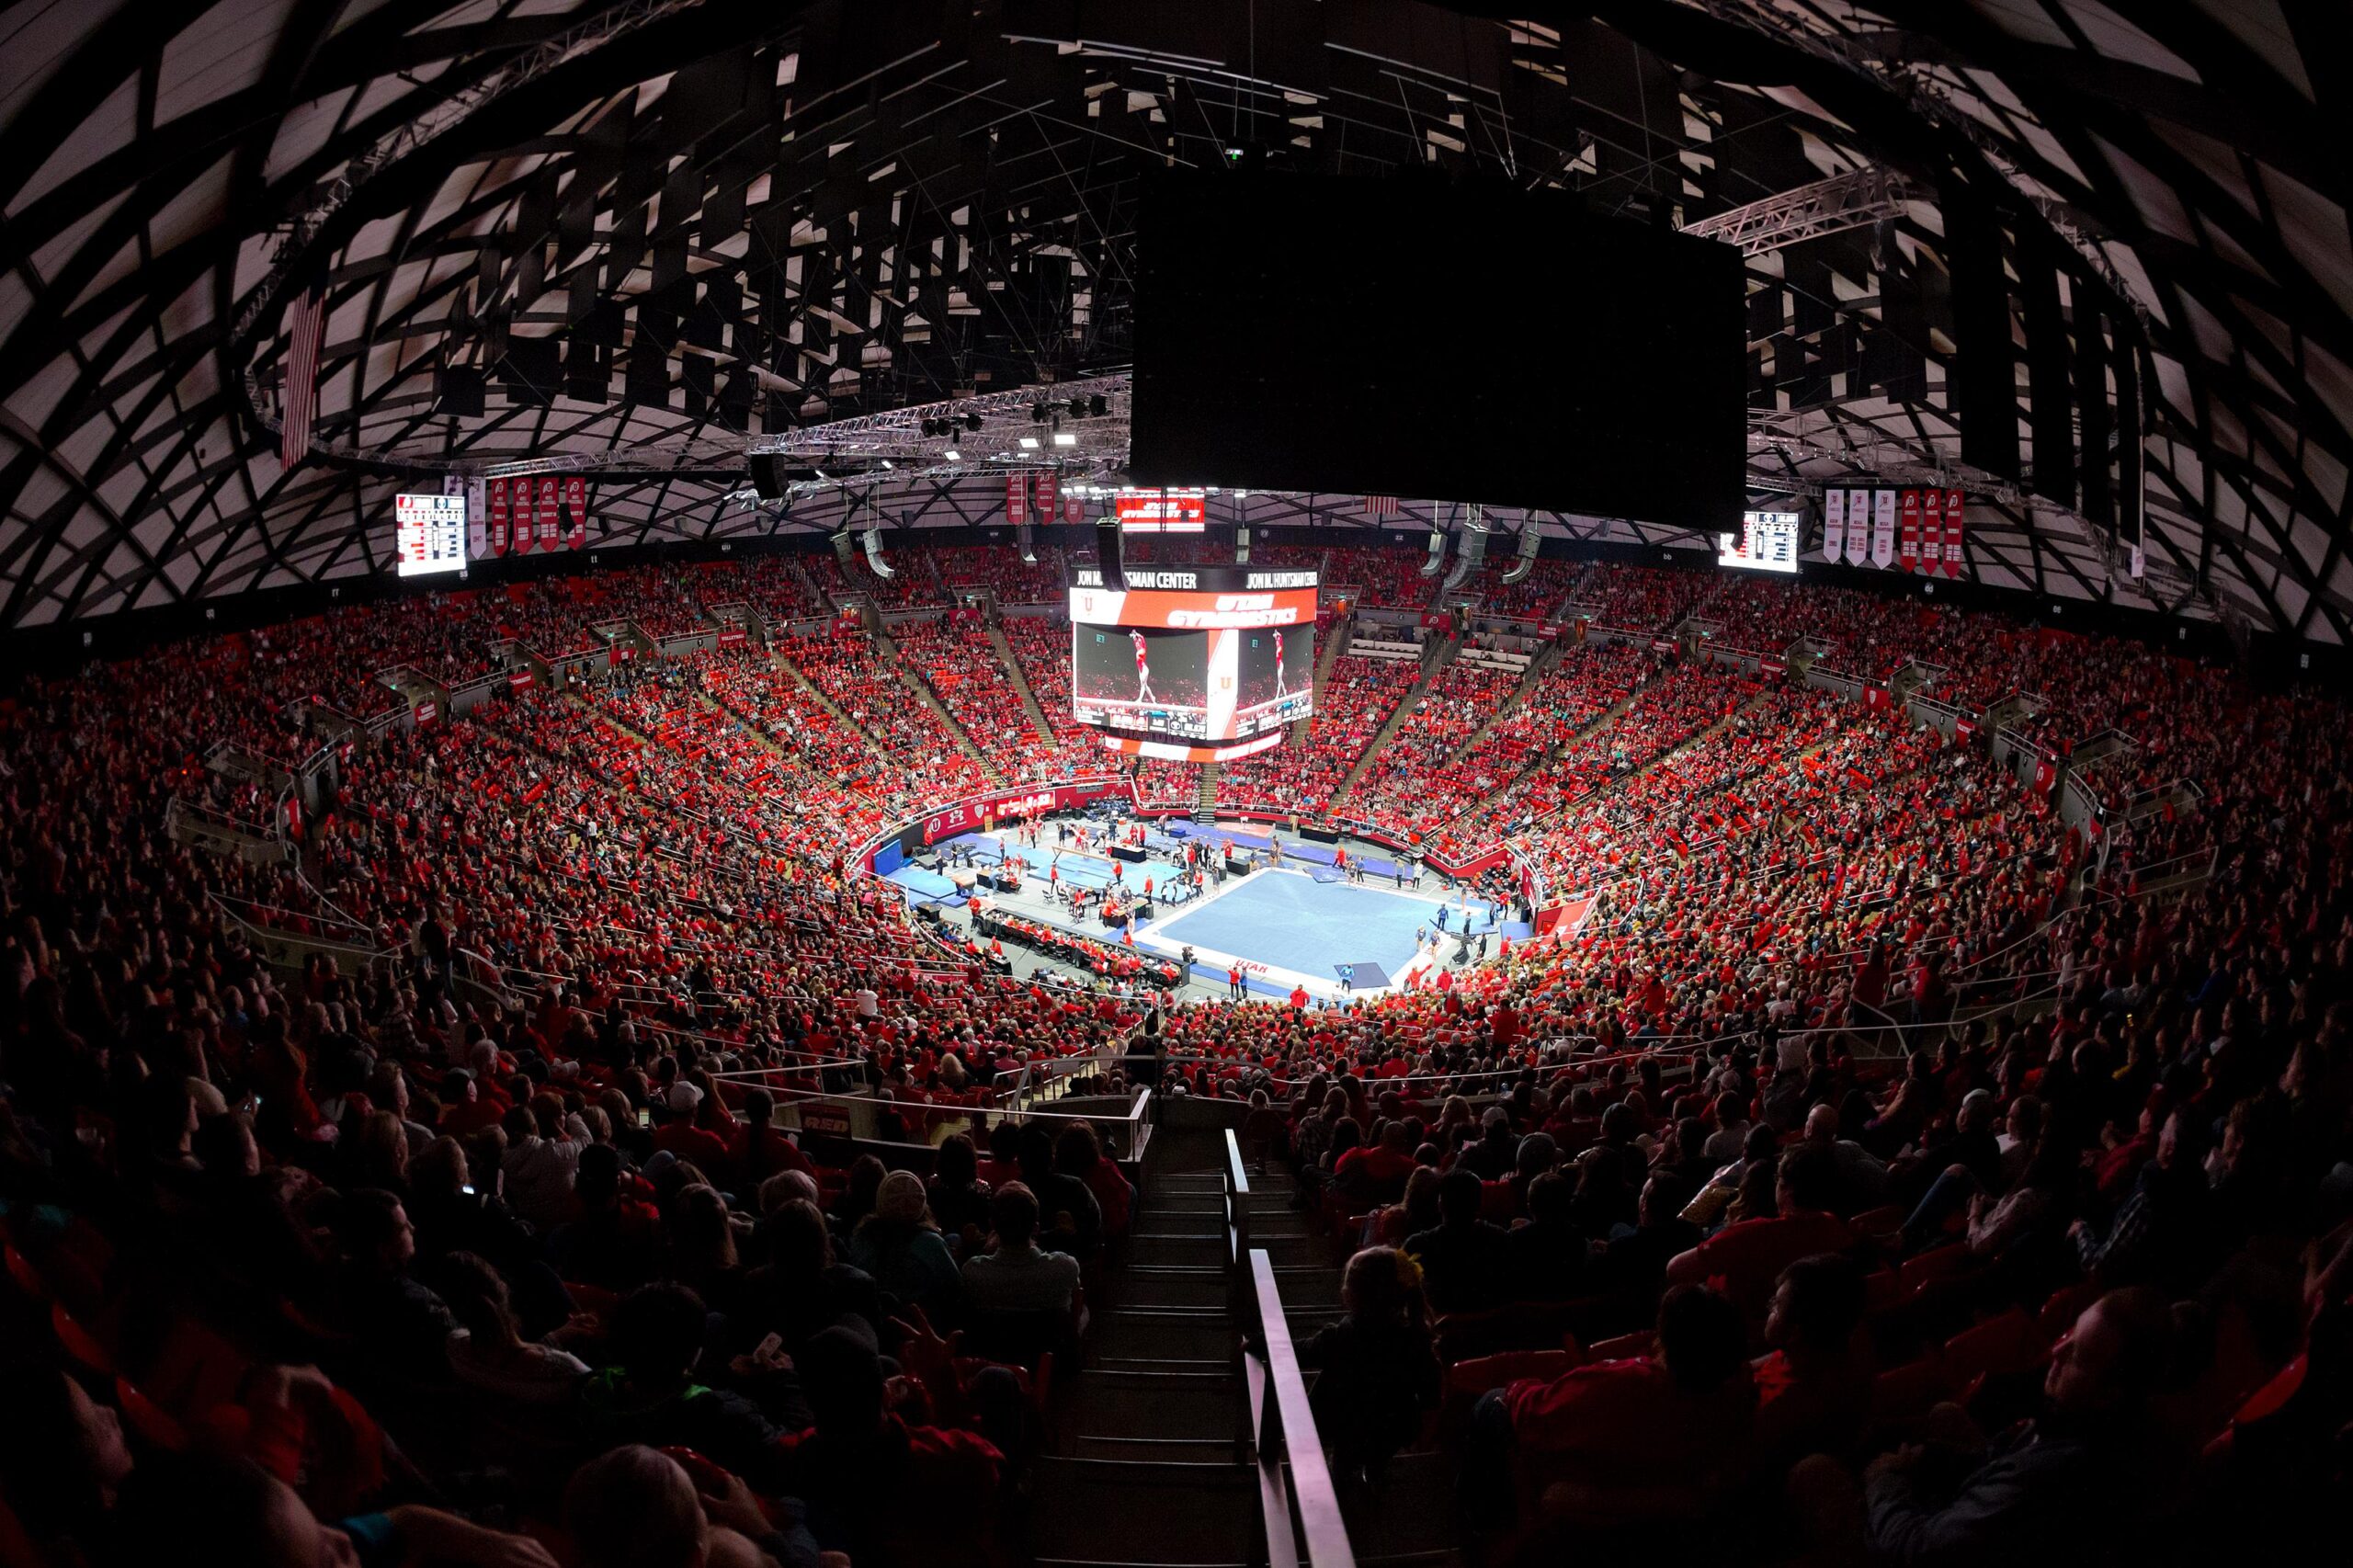
The Huntsman Center in Salt Lake City, home to the University of Utah Red Rocks gymnastics team, is known across the college gymnastics world as a loud, passionate crowd. Utah holds the attendance record for the most fans at a single gymnastics meet (16,019 fans versus Michigan in 2015), has held nearly 40 women’s gymnastics attendance titles and led all NCAA women’s teams in attendance ten times.
Opposing teams have mixed opinions on visiting the Huntsman, with many saying the large crowd makes things more exciting for them, while others worry about the noise of 15,000 fans being a distraction. UCLA’s gymnasts reportedly practiced beam with “annoying” music like Disney and Kidz Bop the week before the meet at Utah this year to try and get used to the noise.
Whether there’s an effect on the gymnasts’ concentration or enthusiasm will have to be left up to them to decide, but I wanted to know whether coming to the Huntsman Center has an effect on an opposing team’s scores.
To do this, I took the scores of Utah’s opponents between 2014 and 2023 (leaving out 2021 because fans weren’t able to attend meets due to Covid restrictions) and compared those scores to the team’s overall away scores for the season. I looked only at regular season meets against Utah, so no regionals or conference championships. This information was gathered directly from RoadtoNationals, which conveniently has a page with every team’s home and away average each year.
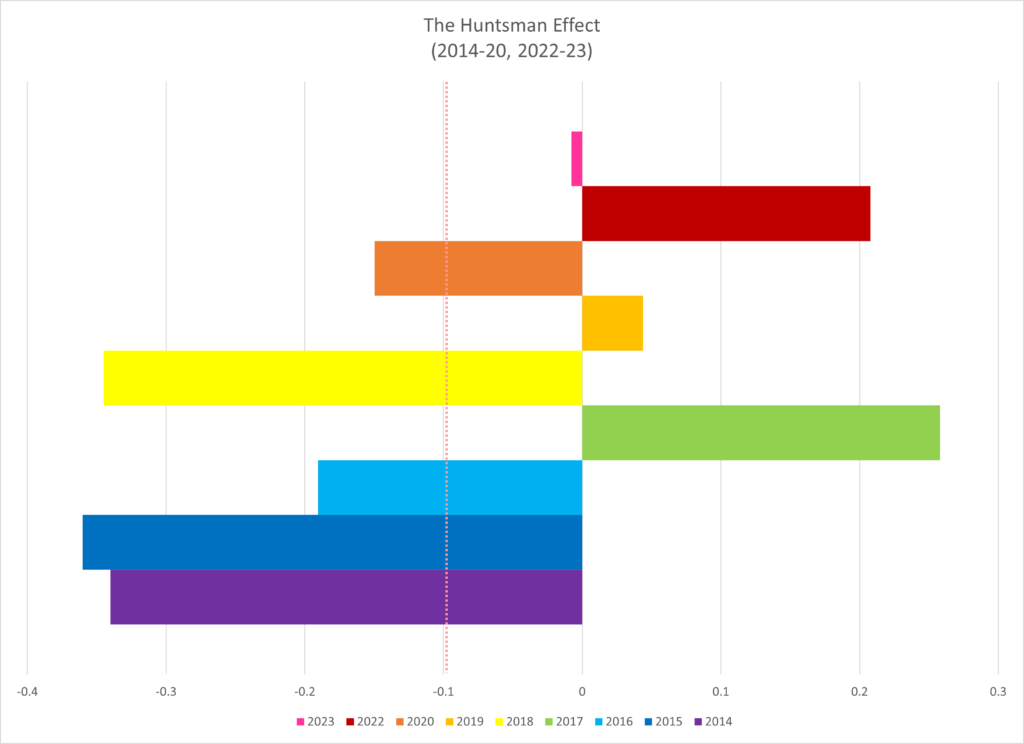
I then took the differences between the score at the Huntsman and the away averages then averaged those over the course of the year and charted them:
| Year | Difference |
| 2014 | -0.340 |
| 2015 | -0.360 |
| 2016 | -0.190 |
| 2017 | 0.258 |
| 2018 | -0.345 |
| 2019 | 0.044 |
| 2020 | -0.150 |
| 2022 | 0.208 |
| 2023 | -0.008 |
| Average | -0.098 |
The results are mixed. Between 2014 and 2016, we saw an average 0.297-point decrease in opposing team’s scores compared to the their away average, while 2017 saw a 0.258-point increase. 2019-23 are less consistent as far as opponents go.
This does include two meets where opponents had multiple falls.
In 2015, UCLA scored 194.725, which was 1.888 points lower than their season away average and included two scores in the 8s on bars and three scores below a 9.5 on beam.
In 2018, BYU scored a 194.275, 1.518 points below their average, and counted a fall on bars and only had one score above a 9.80. This was their first meet of the season, however, and one could chalk the issue up to early season jitters.
In contrast, Stanford fared very well in their meet at Utah in 2017, scoring a 196.275, which was 1.889 points higher than their season away average. They had a season-long issue with counting falls, but only had one fall on beam that ended up not counting.
A Note on 2013
I’d originally included 2013 in my data but 2013, it turns out, was the Year of Bad Balance in the Huntsman, with teams combining for twenty-eight falls over the course of the season, five from Utah and 23 from visitors (Florida was the only one of seven visitors that season that managed to avoid falling on any event).
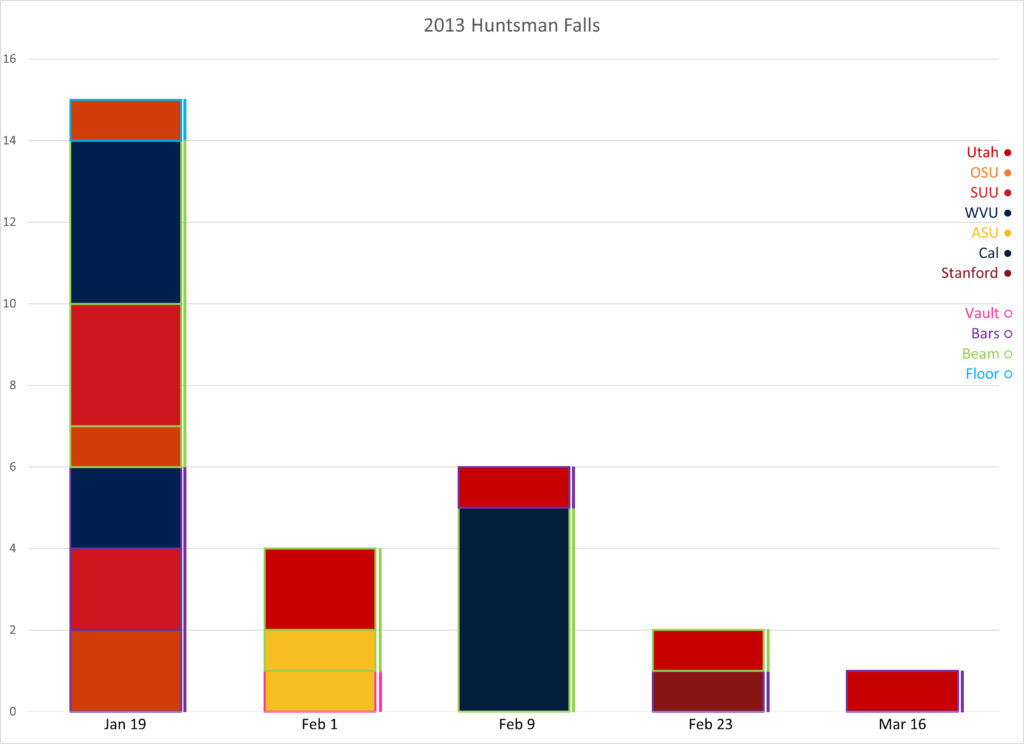
January 19, a quad meet, had 15 falls total from the three visiting teams. The meet on February 9 saw five falls on beam alone from Cal.
In total, there was one fall on vault, nine on bars, 17 on beam (or 23.6% of all beam routines in the Huntsman that season) and one on floor.
The Fan-less 2021
Since I had 2021 in my data anyway, I’ll include the difference here for the curious:
| Year | Difference |
| 2021 | 0.140 |
So being in the Huntsman alone without the crowd improved opponents’ scores by 0.140 in 2021. Maybe the bright red chairs or the delightful poppy music made things more enjoyable for them (the Huntsman has a tendency to play a lot of Taylor Swift and One Direction, which is right up my alley). Maybe they leap higher because of the altitude.
Or maybe it was just the Utah Effect…which is a nice segue to my next analysis.
The Utah Effect
Next I was curious to see whether Utah visiting has a positive or negative impact on opponents, so I compared their score against Utah to their average home score for the season. I included both 2013 and 2021 in my analysis because we’re looking at the influence of the team rather than the crowd this time and there were no balance catastrophes for Utah’s away meets in 2013.
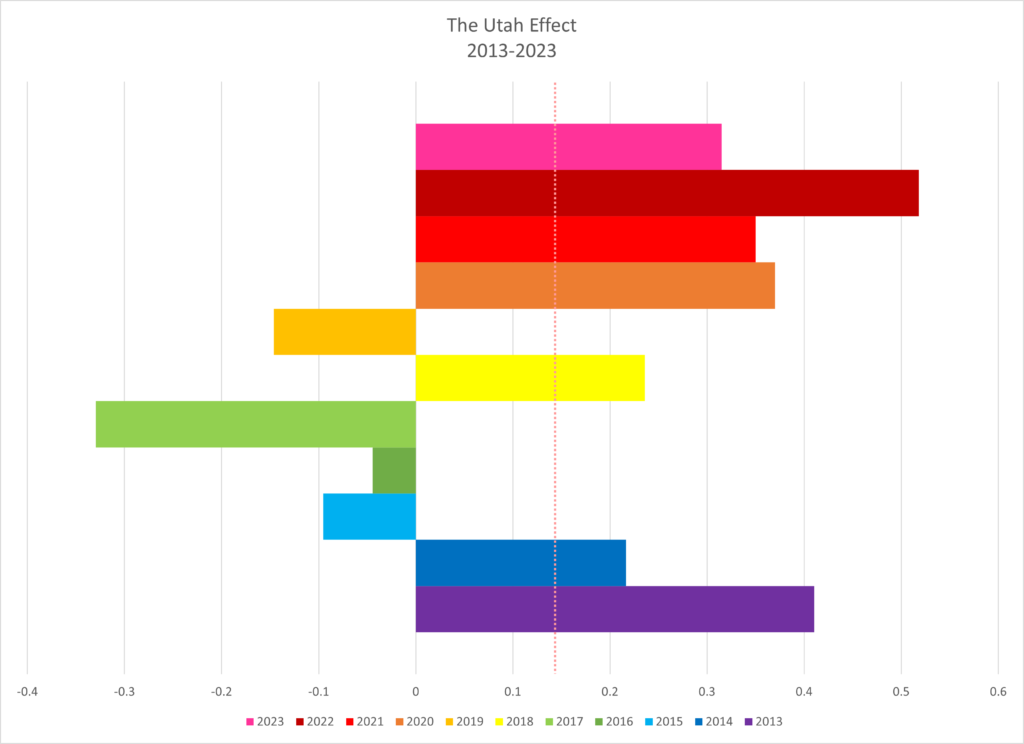
| Year | Difference |
| 2013 | 0.410 |
| 2014 | 0.217 |
| 2015 | -0.095 |
| 2016 | -0.045 |
| 2017 | -0.330 |
| 2018 | 0.236 |
| 2019 | -0.146 |
| 2020 | 0.370 |
| 2021 | 0.350 |
| 2022 | 0.518 |
| 2023 | 0.315 |
| Average | 0.143 |
The numbers here are a bit more consistent, especially in the last four years. When Utah comes to town, teams perform at their best.
Since 2020, teams perform an average of 0.388 points above their season home average against Utah. Twelve of 15 teams have performed above their average (Oklahoma in 2023, Oklahoma in 2021 and Arizona in 2020 were the three who scored lower than their season averages).
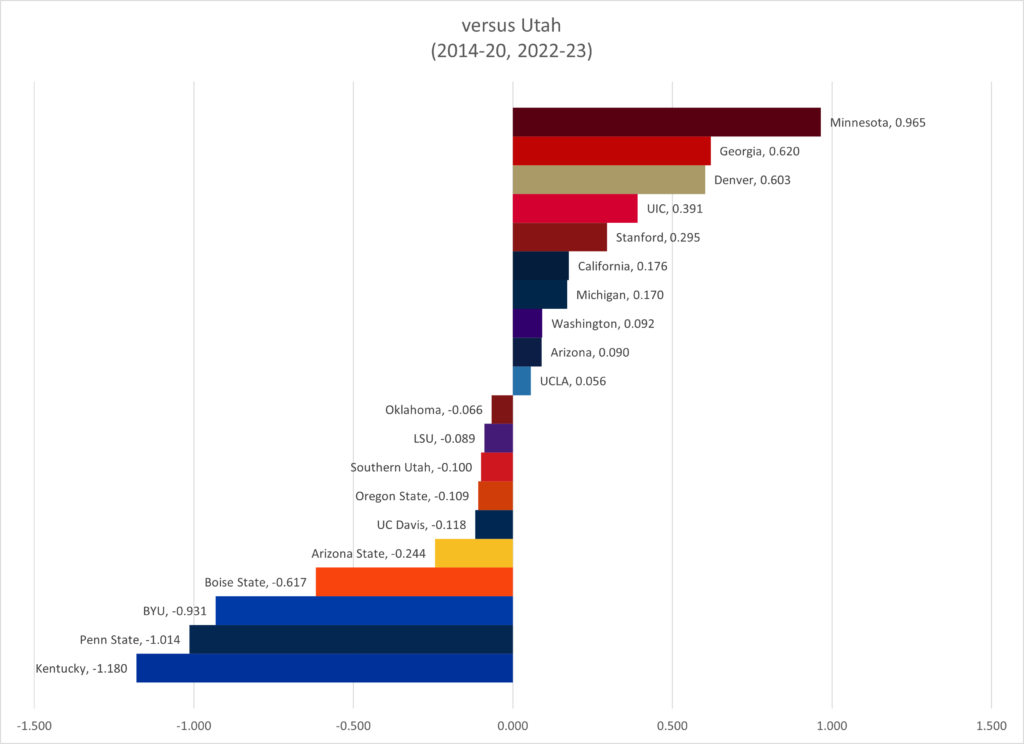
The Teams vs Utah
Next I looked at individual teams’ scores to see who takes the most (and least) advantage of having Utah as their opponent, both away and at home.
First, let’s look at both home and away for 2014-20, 2022-23:
And which teams take advantage of the Huntsman crowds for the same period:
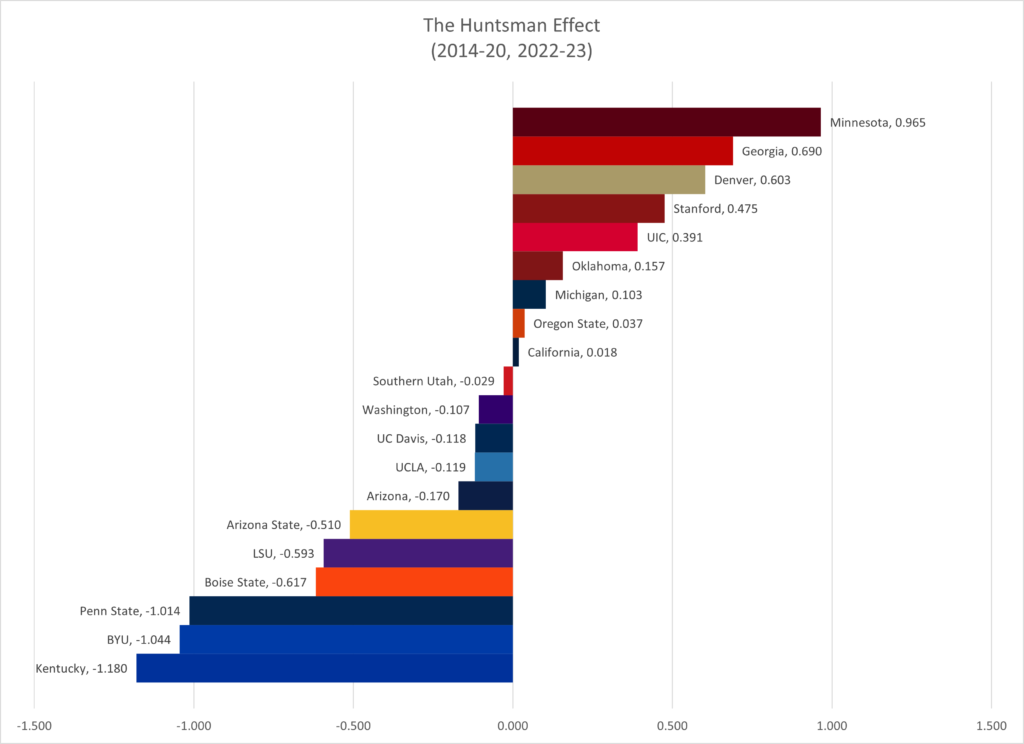
It’s probably a coincidence, but it’s interesting that teams who wear red outperform their away averages while teams that wear blue underperform. Maybe the bright red chairs actually help.
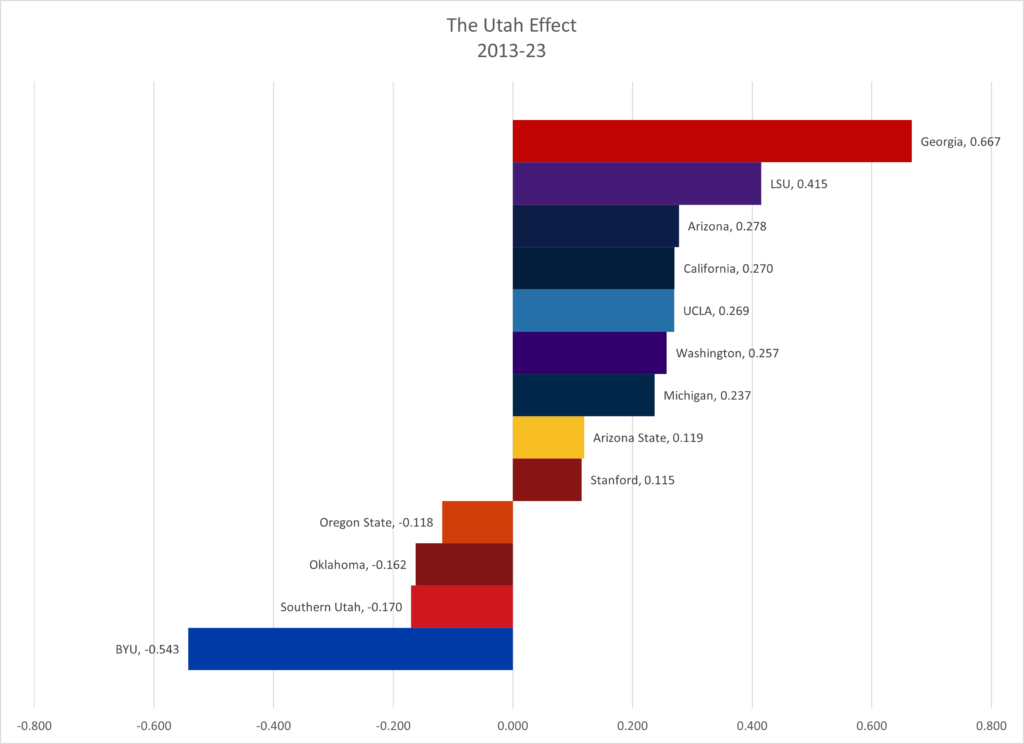
And finally which teams rise to the occasion when Utah comes to town for all of 2013-23: