
Fans of college gymnastics have been loudly complaining about increasing scores over the last few years, with a lot of that ire being directed at top teams hitting the mid-198s and top gymnasts scoring 10s for arguably (or not-so-arguably) imperfect routines. But the issue is far more widespread, with teams outside the top 10 or 20 breaking long-held scoring records and NQS requirements to make regionals or get a seeded ranking increasing by a full point in the last decade.
I decided to take a deeper look at the NQS requirements over the last 25 years (1999-2023) for the top 36 teams to see just how much things have changed and whether that change was actually statistically significant.
Plotting the Data
For this analysis, I collected the top 36 NQSs at the end of the regular season every year between 1999 and 2023 and put it into a single spreadsheet. That data is available to view as a Google Sheets document for those who are curious.
A few notes on NQS scores:
- Prior to 2019, the NQS (National Qualifying Score) was referred to as RQS (Regional Qualifying Score), but the formula for NQS and RQS is the same so there is no discrepancy in how those numbers are calculated.
- Conference championships are considered part of the regular season for NQS purposes.
- In 2020, the season was shortened because of Covid; teams completed 10 instead of 12 weeks during the regular season but NQSs were still calculated. In 2021, in anticipation of potentially canceled meets because of Covid outbreaks, NQS calculations used only the top four scores instead of the usual top six scores in their calculations. The data for 2020 and 2021 was largely consistent with what we saw in prior and subsequent years, so for the sake of continuity of my timeline, I included both 2020 and 2021 in my data.
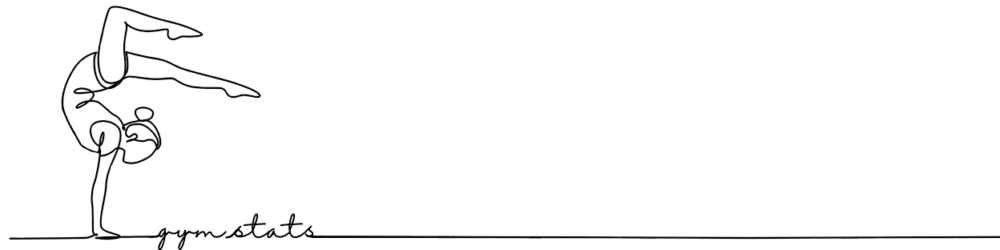
I then put the data into a single scatter plot to get a visual idea of any changes or trends:

Looking at this data, the increase over the years is obvious. We can see an increase of about a point in the top ranks and more than two points for teams ranked in the 30s. Looking more specifically, it looks like there is some consistency within groups of years so scores are more “clumped” into similar ranges. And there is a significant increase in the middle ranks in 2021 and the lowest 10 ranks in 2022 and 2023.
Scoring Consistency Across Years
We can look at those “clumps” of years from a more statistically rigorous perspective using t-tests and ANOVA (or analysis of variance). T-tests allow us to compare two years directly and see whether they’re similar enough to have been from the same data set, or more specifically for our purposes whether the those two years could be considered equally scored. ANOVA tests allow us to compare groups of years to see if there is consistency across all those years. The tests will give us a number between 0 and 1 that gives us the probability (or p-value) of whether the two are likely to be consistent. One of the most commonly used baselines in statistics is a 95 percent confidence interval, which means that the number we’re going to be looking at is 0.05 and whether p-values are above or below that value.
First, I looked at t-tests between each year to get an idea of which groups of years I should start looking into:

Again, higher numbers indicate a higher likelihood that the scoring system was consistent between those two years. I went through and highlighted groups of years that seem to have similar systems. It looks like 1999 and 2000 were fairly similar, then things started getting higher in 2001 and 2002, got significantly higher in 2003 and 2004 (the fabled year of inflated scoring), then got much tighter in in 2005, even tighter in 2006, then started to move back into 2001-02 levels and stayed that way until 2013-ish, then most of the twenty-teens saw consistent scoring and then things started getting even higher in 2021, 2022 and 2023.
Let’s look at those groups individually.
1999-2007
First, let’s tackle 1999 through 2007. It was kind of a mess. There wasn’t really any consistency across this period for more than a year or two, and the scores didn’t get consistently higher year over year across the entire period.

| Year | Average | Max | Min | Variance |
| 1999 | 195.112 | 197.444 | 193.513 | 1.041 |
| 2000 | 195.356 | 197.255 | 194.155 | 0.772 |
| 2001 | 195.883 | 197.640 | 194.610 | 0.778 |
| 2002 | 195.677 | 197.240 | 194.575 | 0.666 |
| 2003 | 196.330 | 197.980 | 195.285 | 0.569 |
| 2004 | 196.680 | 198.055 | 195.675 | 0.464 |
| 2005 | 195.507 | 197.320 | 194.135 | 0.799 |
| 2006 | 195.181 | 197.305 | 193.210 | 1.269 |
| 2007 | 195.595 | 197.435 | 193.985 | 1.011 |
I won’t pretend to be a gymnastics historian and don’t remember much from the early Aughts as far as overall gymnastics goes because I was a teenager (I was born in 1987 so I would’ve been 12 at the turn of the Millennium), gymnastics coverage wasn’t great (to say the least) and the internet was not nearly as straightforward for collecting information as it is today so I remember very little outside of Utah’s team and performance. But from my understanding, the period in the late 90s and early Aughts was the point where college gymnastics was starting to really find itself as a sport and scores were starting to get closer to where we are now.
We went from Utah winning the title in 1983 with a team total of 184.650 and scores for other semifinalists ranging from 183.300 for Arizona State and 165.550 for Nebraska to 1995 with Utah winning with a 196.650 and scores ranging from 196.425 for Alabama/Michigan to 189.650 for West Virginia:

The mid-90s is when year-to-year increases among the lower half of teams competing at nationals started to narrow and all teams started to move into the 190s, and I think judges were having difficulty figuring out what they wanted college gymnastics scoring to look like moving forward and it took a few years for things to even out a bit. Once we hit around 2007 or so, there were clear patterns in scoring consistency for a few years at a time.
| Year | Average | Difference |
| 1999 | 195.112 | |
| 2000 | 195.356 | 0.244 ^ |
| 2001 | 195.883 | 0.527 ^ |
| 2002 | 195.677 | -0.206 v |
| 2003 | 196.330 | 0.653 ^ |
| 2004 | 196.680 | 0.350 ^ |
| 2005 | 195.507 | -1.172 v |
| 2006 | 195.181 | -0.326 v |
| 2007 | 195.595 | 0.414 ^ |
Interestingly, the scoring system we saw in groups of these years (1999-2000, 2006; 2001-02, 05,07; 2003; 2004) generally coincide with a scoring system for a group of years later on in our analysis period. I will include these years with the later groups.
First I will add the scatterplots, ANOVA p-values and tables for each group of years, then I will do some analysis of the different periods.
1999-2000 and 2006
Scores generally got higher each year as we moved from 1999 to 2004, with 2003 and 2004 being the most statistically significant increase. After the score reckoning in 2004, 2005 saw lower scores and 2006 was even tighter, with scores moving back down to the 1999-2000 level before moving back up.

| Year | Average | Max | Min | Variance |
| 1999 | 195.112 | 197.444 | 193.513 | 1.041 |
| 2000 | 195.356 | 197.255 | 194.155 | 0.772 |
| 2006 | 195.181 | 197.305 | 193.210 | 1.269 |
| Average | 195.216 | 197.335 | 193.626 | 1.027 |
2001-02, 2005 and 2007-2012

| Years | Average | Max | Min | Variance |
| 2001 | 195.883 | 197.640 | 194.610 | 0.778 |
| 2002 | 195.677 | 197.240 | 194.575 | 0.666 |
| 2005 | 195.507 | 197.320 | 194.135 | 0.799 |
| 2007 | 195.595 | 197.435 | 193.985 | 1.011 |
| 2008 | 195.604 | 197.400 | 194.065 | 0.930 |
| 2009 | 195.758 | 197.255 | 194.625 | 0.617 |
| 2010 | 195.782 | 197.250 | 194.385 | 0.716 |
| 2011 | 195.662 | 197.190 | 194.145 | 0.656 |
| 2012 | 195.949 | 197.445 | 194.770 | 0.645 |
| Average | 195.703 | 197.317 | 194.366 | 0.758 |
2003 and 2013-2020
2004 is the year known among gymnastics fans as the year with the highest scoring that required a “come to Jesus” moment among judges. That started in 2003, which saw a measurable increase over the previous years but wasn’t quite as wild as 2004. Things moved back down to pre-2003 levels for about a decade, but started to rise back up to be consistent with 2003 levels (but not quite 2004 levels) starting in around 2013. Notably the p-value for 2003 and 2013-2020 is 0.906, which indicates scores were very consistent over this period in a way we haven’t seen before or since.

| Year | Average | Max | Min | Variance |
| 2003 | 196.330 | 197.980 | 195.285 | 0.569 |
| 2013 | 196.246 | 197.840 | 195.065 | 0.631 |
| 2014 | 196.317 | 197.895 | 195.160 | 0.644 |
| 2015 | 196.380 | 197.895 | 195.355 | 0.595 |
| 2016 | 196.401 | 197.920 | 195.385 | 0.494 |
| 2017 | 196.450 | 198.010 | 195.420 | 0.557 |
| 2018 | 196.441 | 197.995 | 195.520 | 0.429 |
| 2019 | 196.353 | 198.025 | 195.250 | 0.609 |
| 2020 | 196.515 | 198.080 | 195.420 | 0.475 |
| Average | 196.381 | 197.960 | 195.318 | 0.559 |
2004 and 2021
2004 is the year known among gymnastics fans as the year with the highest scoring that required a “come to Jesus” moment among judges. We saw 98 perfect 10s given, which is a record that still exists today despite the craziness of the last couple of years (2023 saw 84 10s and 2022 saw 71). The top team (UCLA) had an NQS above 198, a barrier we didn’t see passed again until 2017 (that level has been reached 9 times since then – one each in 2017, 2019, 2020 and three each in 2022 and 2023).
After 2004, scores moved back down significantly then increased back to 2003 levels between 2013 and 2020, then 2021 hit the same level we saw in 2004.

| Year | Average | Max | Min | Variance |
| 2004 | 196.680 | 198.055 | 195.675 | 0.464 |
| 2021 | 196.747 | 197.844 | 195.769 | 0.469 |
| Average | 196.713 | 198.000 | 195.722 | 0.466 |
2022 and 2023
2022 and 2023 saw scores get even higher than what we saw in 2004. There may have been fewer 10s, but NQSs were higher across the board, especially among the lower half of regionals teams.

| Year | Average | Max | Min | Variance |
| 2022 | 196.941 | 198.140 | 196.215 | 0.349 |
| 2023 | 197.092 | 198.375 | 196.285 | 0.365 |
| Average | 197.016 | 198.258 | 196.250 | 0.357 |
Comparing the Groups

I took the average NQS of each rank within a group (so the average of rank 1 for 1999, 2000, 2006, rank 2 for the same years, rank 3, etc), to see how the scoring among the ranks changed as we moved to different groups.
As we can see, the average NQS for the lower ranks increased for each group of years. However, the NQS for the top handful of ranks was the same for two groups. So either one team was significantly better than the rest of the teams within a group of years or one team was scored significantly better than the rest of the teams.
| Period | Average | Max | Min | Variance | p-value |
| 1999-2000, 2006 | 195.216 | 197.335 | 193.626 | 1.027 | 0.576 |
| 2001-02, 2005, 2007-12 | 195.703 | 197.317 | 194.3066 | 0.758 | 0.460 |
| 2003, 2013-20 | 196.381 | 197.970 | 195.354 | 0.547 | 0.906 |
| 2004 and 2021 | 196.713 | 198.000 | 195.722 | 0.466 | 0.680 |
| 2022-23 | 197.016 | 198.258 | 196.250 | 0.357 | 0.287 |

As expected, each group of years saw increasing NQS numbers across the board, with the average and minimum scores getting closer to the maximum scores. We also saw the variance decrease as the scores grew higher, which is to be expected as the lower scores get closer to the higher scores.
Rank Equivalencies
Next I wanted to look at what NQS would be needed to get a certain rank in each year.
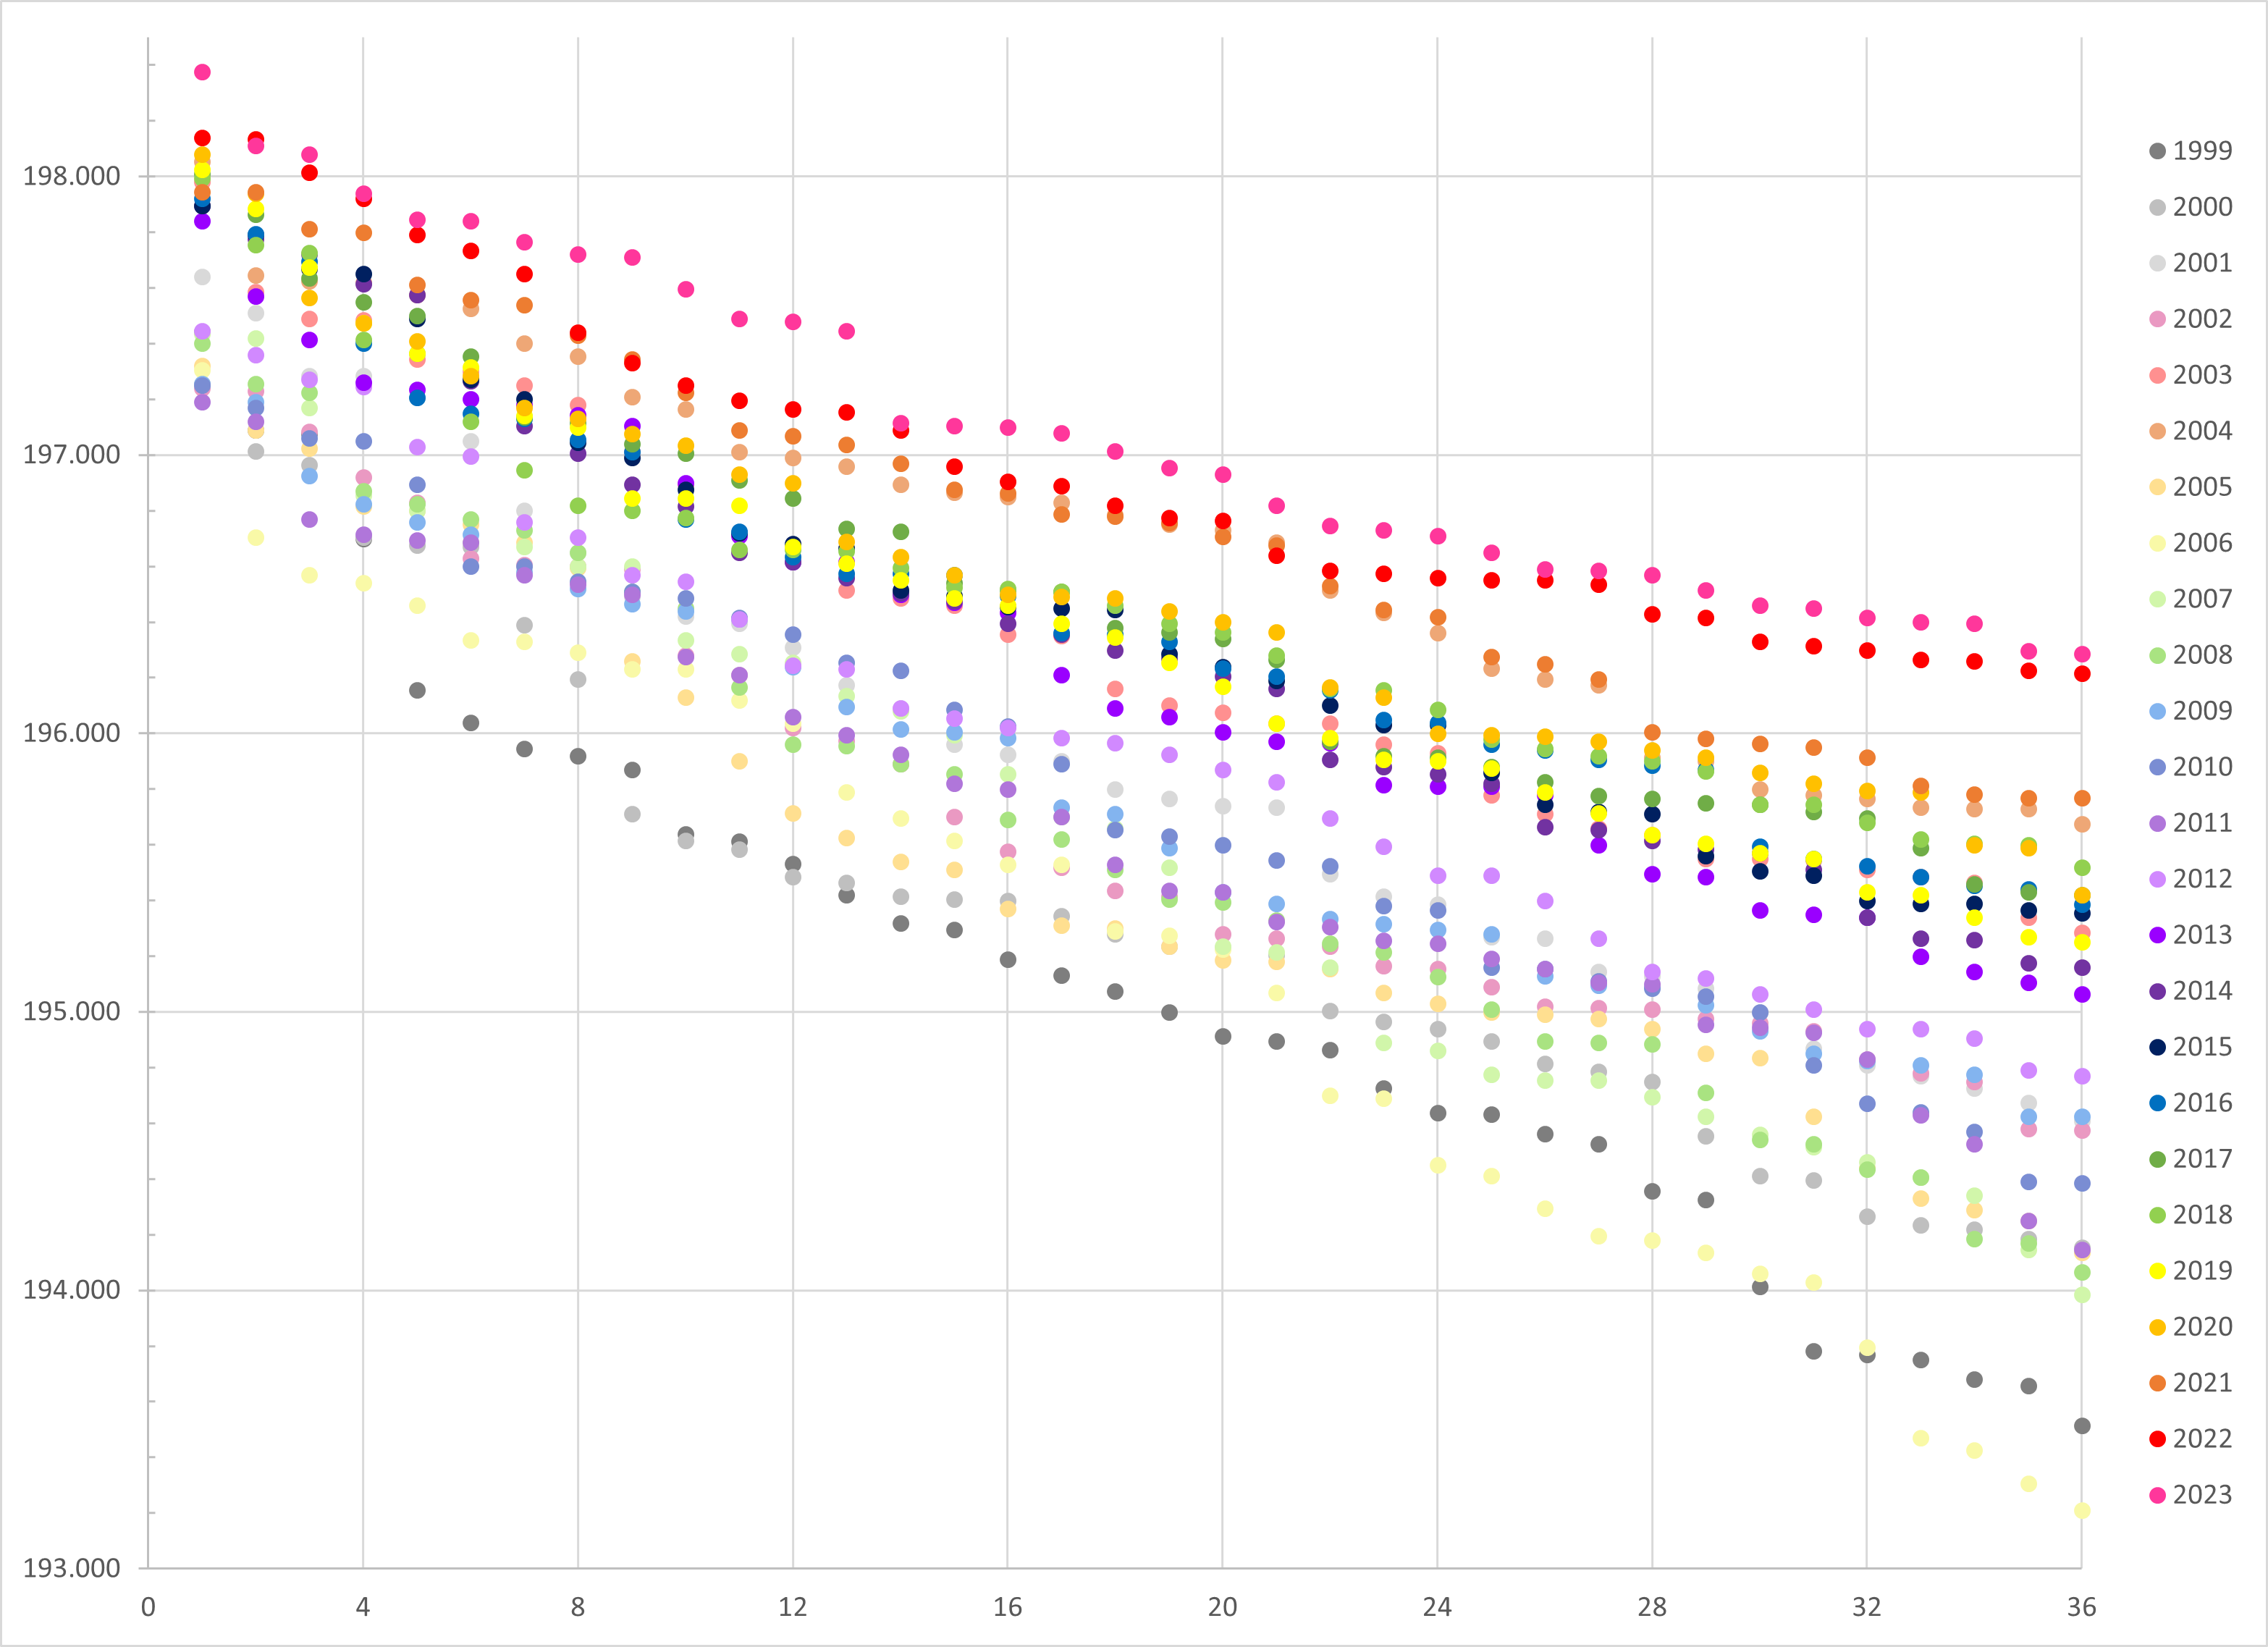
For my first rank analysis, I looked at 2023’s ranks 8, 16, 24 and 36 then went backwards through 1999 to see how much things have increased rank-wise in the last quarter century.
| Rank | NQS |
| 8 | 197.720 |
| 16 | 197.100 |
| 24 | 196.710 |
| 36 | 196.285 |

2023’s rank 8 is a good indicator of how much scores at the top have risen in the last couple of years. The NQS required to hit rank 8 in 2023 (197.720) would put a team at rank 1 up until 2013. Even 2003 and 2004, the years of the inflated scoring, would still put the team at rank 2. A team with that NQS would be a 1 seed at regionals every year until 2021.
Some of the biggest increases in rank come in the bottom half of the NQS numbers for 2023.
Being the last spot (36th) would be the equivalent of a seeded spot up until 2012 (except 2003-04). The 24th ranked team would be seeded every year until 2020 (except 2004).
The largest increase in rank is the 24th team from 2023 (NQS 196.710) would move all the way up to second in 2006. That means 23 teams scored above a 196.710 in 2023 but only one scored above that in 2006.
I then chose 2010 as my second sample since it’s about halfway between my start and endpoints. The NQS requirements to get each of the following ranks were:
| Rank | NQS |
| 1 | 197.250 |
| 8 | 196.545 |
| 16 | 196.025 |
| 24 | 195.365 |
The top ranked team in 2010 (Alabama) scored a 197.250 NQS. That mark would result in a 1 seed (ranks 1-6) every year between 1999 and 2013 (except 2003-04), in 2016 and in 2018. It would put you as a 2 seed in 2014, 2015, 2017, 2019 and 2020. But by 2023, you would only be a 4 seed.
An NQS of 196.025 would net you rank 16 and a seeded spot at regionals in 2010 wouldn’t even get you into a play-in meet in 2022 or 2023.
And 2010’s rank 24 with an NQS of 195.365 would miss out on regionals in 2004 and every year after 2015 except 2019, where you would barely slide in at rank 34.
NQS Requirements
I looked at the difference in NQS requirements to make regionals (rank 36) every year compared to the 196.285 required to make regionals in 2023.
The differences vary between only 0.070 points lower in 2022 to 3.075 points lower in 2006. 2004 is higher than every year except 2021-22 with a difference of 0.610 points.
Next I looked at the difference in requirements to finish with the top NQS compared to the 198.375 required in 2023.
These numbers are much closer together with a maximum of only 1.185 points in 2011.
We saw the NQS for the top ranked team hit at least a 198.000 in six years; 2004, 2017, 2019, 2020, 2022 and 2023.
The largest single-year increase came in 2003, when the top NQS jumped from 197.240 in 2002 to 197.980 in 2003. There was also a significant jump from 2012’s 197.445 (the last year the top NQS fell below 197.500) to 2013’s 197.840.