
It’s no secret that scores across the country have increased significantly over the last three years. We’ve seen the number of Perfect 10s awarded rise from only 14 a decade ago to 71 in 2022 and 73 already in 2023. The minimum NQS requirement to make the postseason increased more than a point between 2013 and 2023, with the bulk of that increase coming in the last several years.
Even with the score inflation during the regular season, a lot of college gymnastics fans feel a sense of relief that at least the postseason will “even things out” and additional judges at competitions will bring those scoring scores back down to Earth. But are their assurances based on reality? Is postseason scoring tougher than what we see during the regular season?
For this analysis, we took every full team score for both the regular and postseason between 2016 and 2022, excluding 2020 season because Covid forced an early end to the season and postseason didn’t come into play. We first looked at all 36 teams who made it to the regionals competition (note that only 34 teams competed in the 2021 postseason because of Covid protocols) and divided their scores into “regular season” and “postseason” categories.
For the purpose of this analysis, we considered conference championships, regional competition and the national championship as postseason because of the additional judges – four judges score each apparatus at the conference championships and regional competition while six judges score each apparatus at the national championship. For simplicity’s sake, every other competition was considered “regular season” even if a team competed in an event that had four judges per apparatus.
We then took an average of the regular and postseason scores for each of the teams, excluding any outlier performances in the postseason (any performance that was more than 1.5 points lower than the team’s NQS) to limit the impact of an unusual postseason performance for a team. As an example, in 2022, Michigan had to count falls on both bars and beam during the national semifinal, scoring only a 196.2875, which is more than 1.7 points lower than their NQS of 198.015, so that score was eliminated from consideration. Thirteen scores among the 578 total postseason scores were removed as outliers.
Regular vs Postseason Scores for Regionals Teams
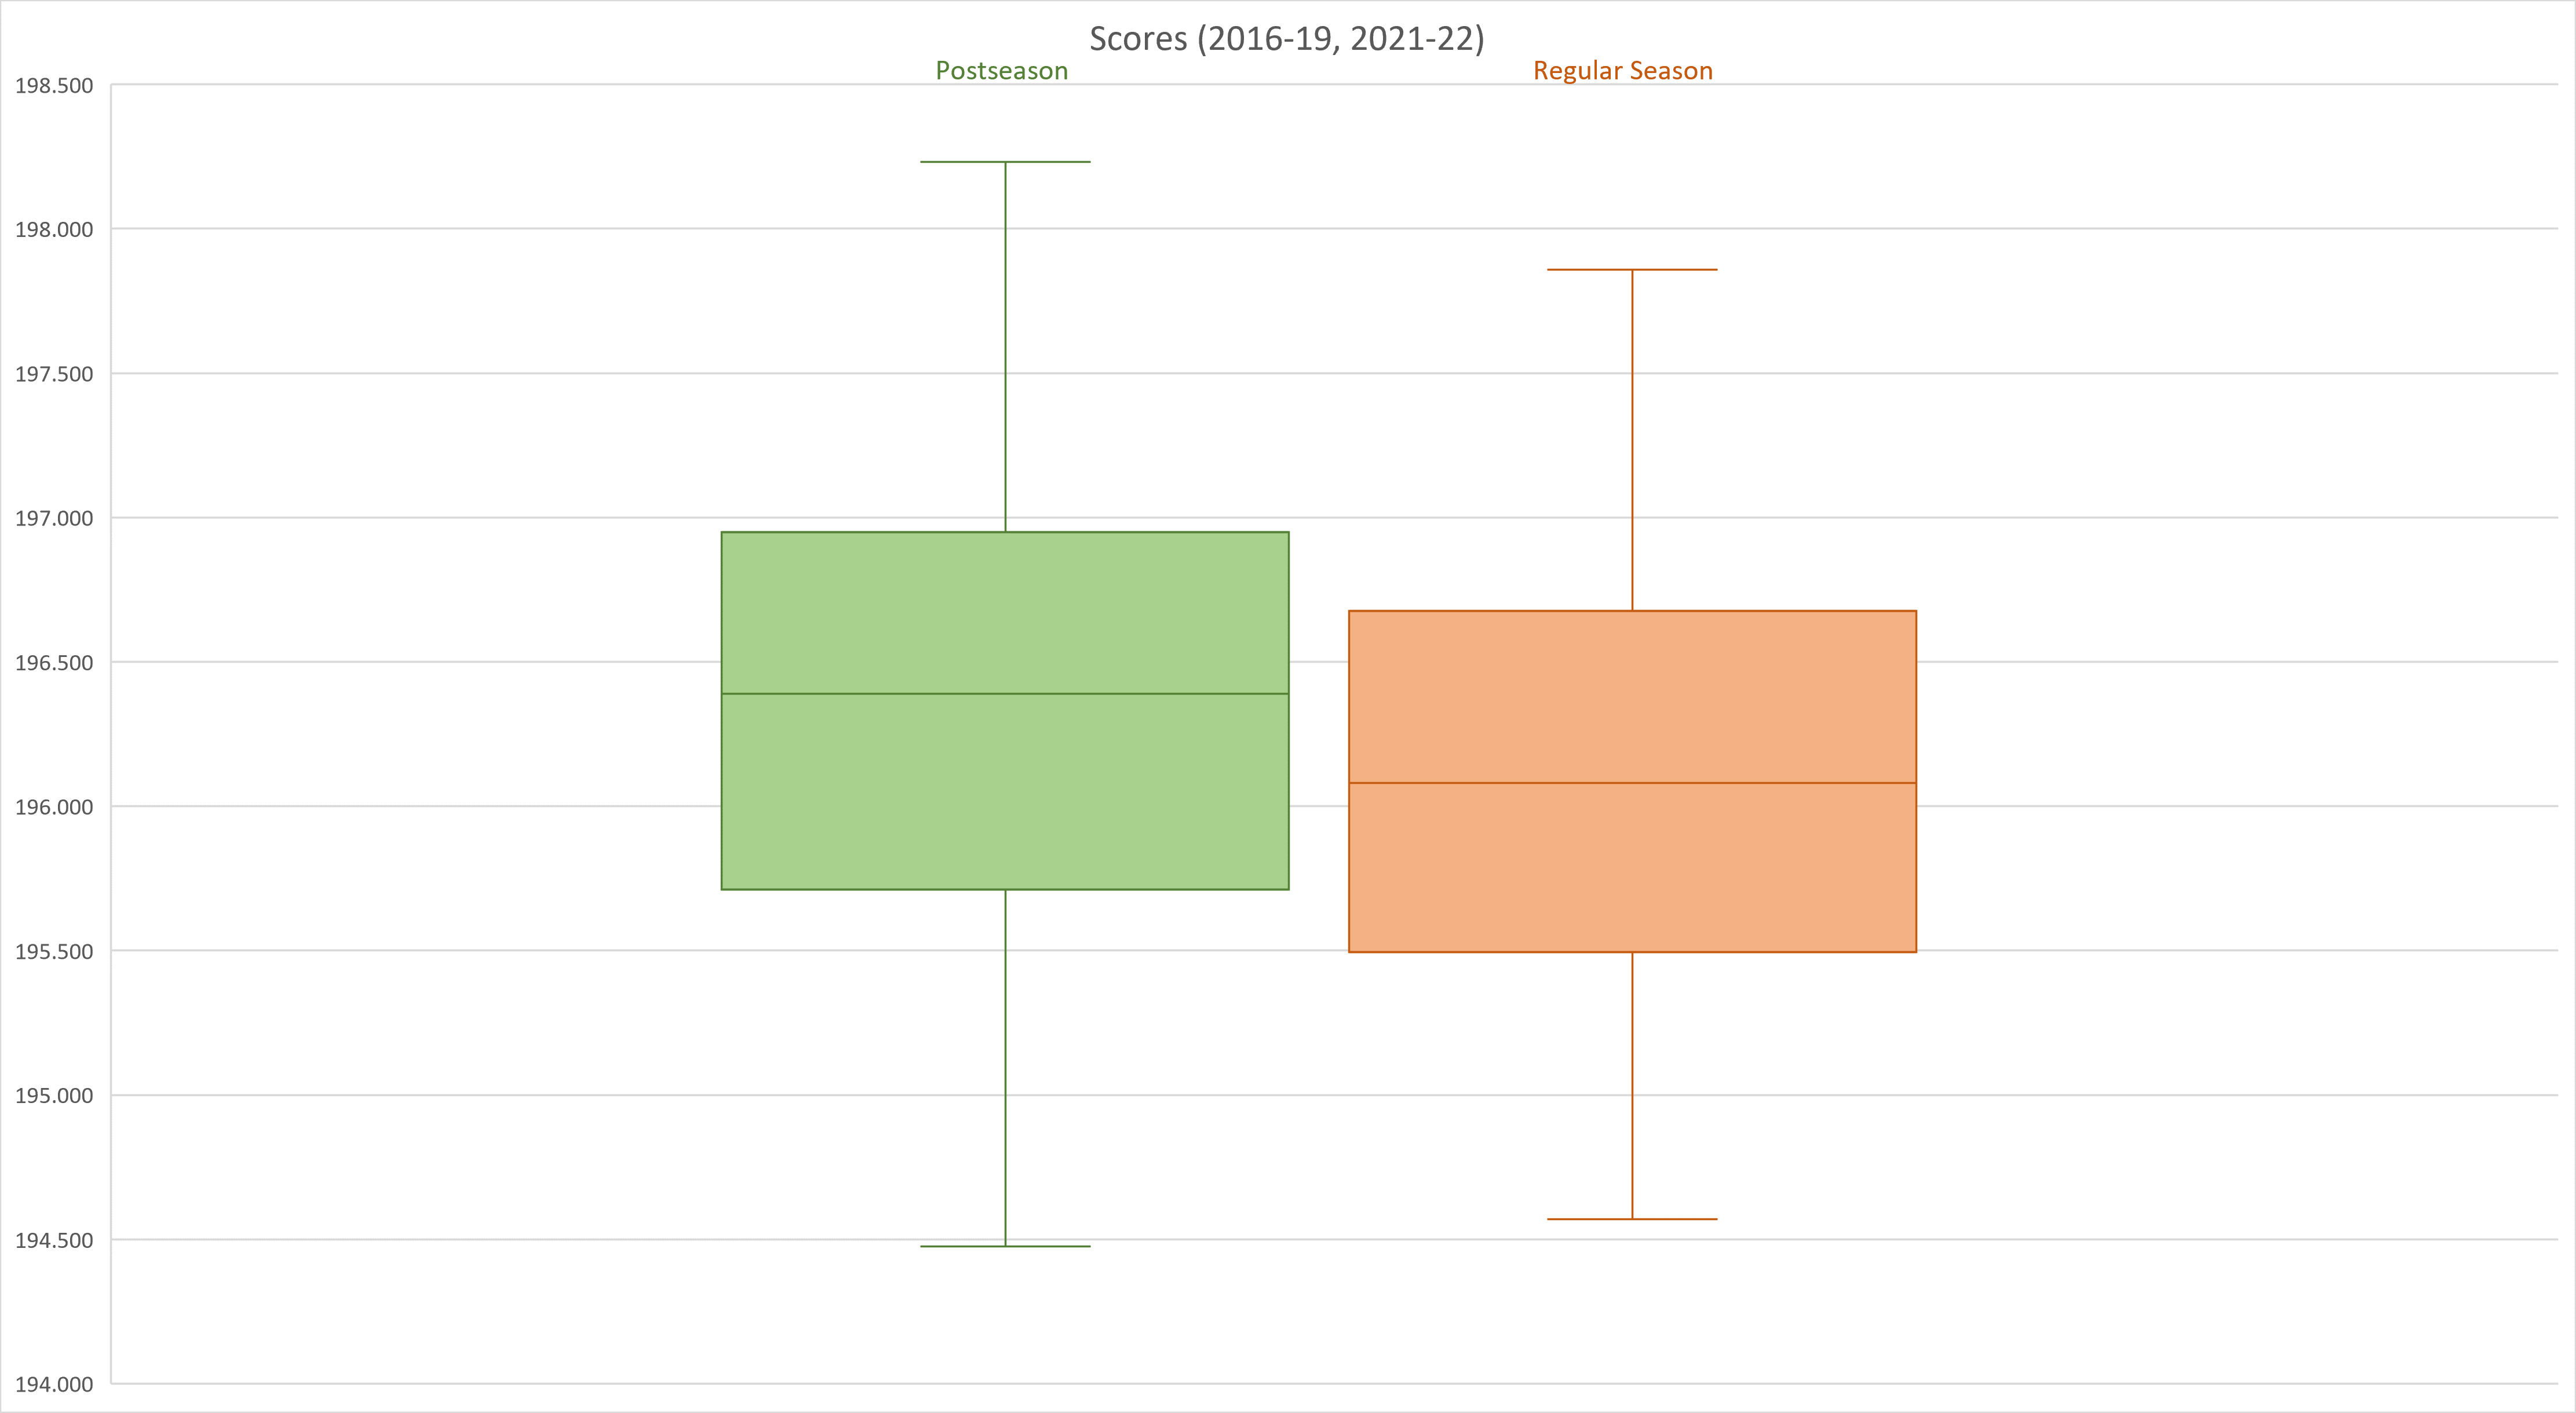
After taking averages of regular season and postseason scores, we combined them into a single dataset and created a box-and-whisker plot to give a visual of the distribution of scores. This shows us that not only are postseason scores not tougher than regular season scores, they’re actually higher than what we see during the regular season.
Numerically, the average of postseason scores is a 196.372 while the average of regular season scores is a 196.140, which means you’d expect to see an average 0.233 points higher scores in the postseason than the regular season.

| Average Score | |
| Postseason | 196.372 |
| Regular Season | 196.140 |
Trying Again – Postseason Scores for Regional Teams
Since the regular season versus postseason scoring hypothesis was a bust, we decided to look at some additional metrics to see whether there is any truth to the claims about tougher postseason scoring.
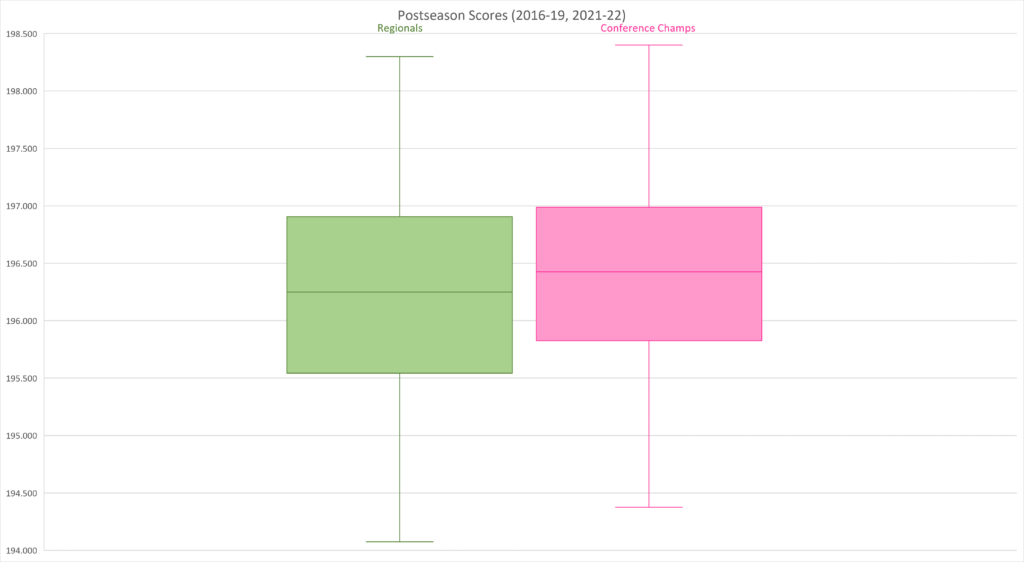
First, since teams tend to improve over the course of the season, we looked specifically at the second half of the season, taking an average of only meets during the last five weeks of the regular season, as well as the NQS for each team. We separated conference championships and regional competition to see whether there is a difference between the two despite the four judges.

| Average Score | Maximum | Minimum | |
| Regionals | 196.267 | 198.300 | 194.075 |
| Conference Champs | 196.472 | 198.400 | 193.900 |
| Regular Season | 196.140 | 197.859 | 194.571 |
| Last Half of Season | 196.434 | 198.075 | 194.150 |
| NQS | 196.604 | 198.14 | 195.385 |
Now we’re starting to see a decrease when it comes to postseason scoring! The scoring for the last half of the regular season seems to be about equal to the scoring for the postseason, which indicates that there probably isn’t much of a decrease in scoring during the postseason. NQS is notably higher than the other metrics, especially in the lowest 25 percent of scores (the “whisker” line below the box of the NQS plot), which is not surprising since NQS is designed to get rid of the lowest scores.
Let’s dive a bit deeper into the differences to see if we can turn that “probably” the same or lower into statistically significantly lower.
For this analysis, we took the differences between averages for regionals compared to the regular season, last half of the regular season and NQS for each team. As an example, let’s look at Oklahoma’s 2022 score averages:
| Average Score | Difference from Regionals | Difference from Champs | |
| Regionals | 198.175 | ||
| Conference Champs | 198.200 | – 0.025 | |
| Regular Season | 197.793 | 0.382 | 0.407 |
| Last Half of Season | 197.921 | 0.254 | 0.279 |
| NQS | 198.140 | 0.035 | 0.060 |
First, let’s look at regionals scores and conference championships specifically to see if there is consistency between the two four-judge competitions.
| Difference from Regionals | |
| Conference Champs | 0.184 |
We can use something called t-tests to calculate whether the averages from two sets of data are equal or not. What this means is that we can take the averages from regionals and compare them against the averages from conference championships to see whether we can say that they are the same, higher or lower.
| t-test | Regionals |
| Conference Champs | 0.017 |
One of the most common confidence intervals statisticians use is a 95 percent interval, which means that we want to see scores lower than 0.05 on our t-test to say that there is a difference in the averages. Looking at these numbers, we can say with 95 percent confidence that conference championship scoring is higher than regionals scoring.
That means that we have to compare regionals scoring and conference championship scoring to the three regular season metrics (full regular season, last half of the regular season and NQS) separately.
Let’s look at conference championship scores first. We put those differences for each of the 36 regionals teams for 2016-2019, 2021 and 2022 into one chart and plotted them, then looked at the t-tests for these statistics:
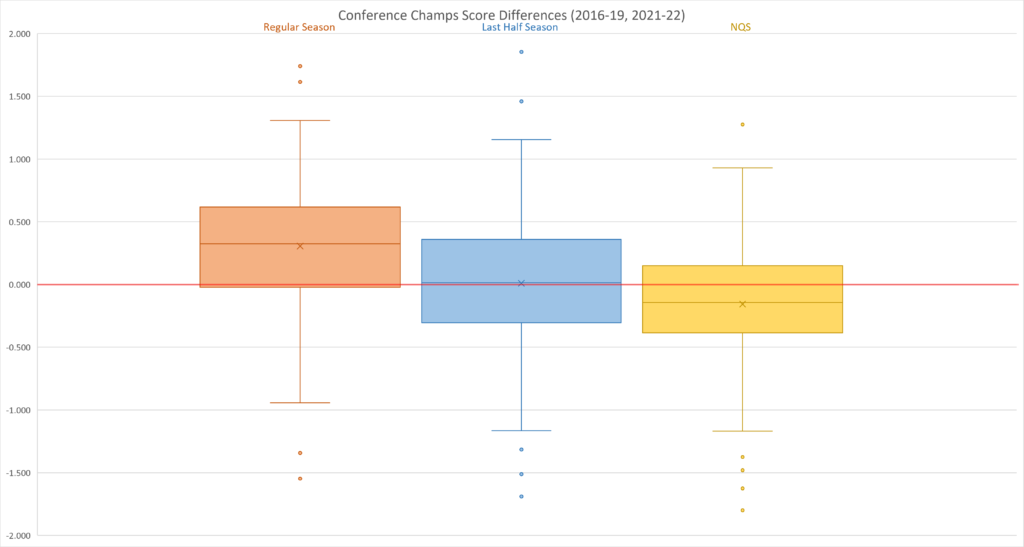
| Average Difference from Conference Champs | T-test versus Conference Champs | |
| Regular Season | 0.306 | < 0.001 |
| Last Half of Season | 0.009 | 0.460 |
| NQS | -0.156 | 0.020 |
Remember that we’re looking for numbers less than 0.05 in our t-tests to tell us whether there is a difference between the two datasets. Based on our analysis, scoring for conference championships is higher than the regular season as a whole, about the same as the last half of the regular season and lower than NQSs.
Let’s see if the same holds true for regionals:
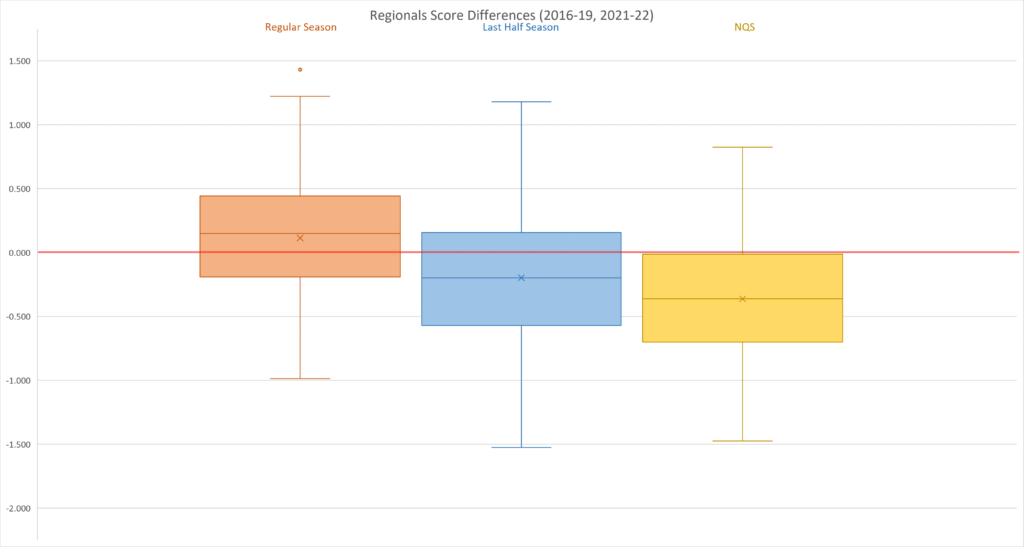
| Average Difference from Regionals | T-test versus Regionals | |
| Regular Season | 0.114 | 0.122 |
| Last Half of Season | -0.198 | 0.009 |
| NQS | -0.363 | < 0.001 |
Based on these numbers, regionals scoring is a bit higher than the regular season as a whole, but it’s not a statistically significant difference. In contrast, regionals scoring is lower than NQS and scoring from the last half of the regular season.
So when looking at postseason scoring, we can expect conference championship numbers to be closest to the last half of the regular season and regionals scoring to be closest to the regular season as a whole.
Comparing Nationals Scores
Next, we wanted to see if those trends hold true for teams that make nationals specifically. Because the number of teams who advanced to nationals was reduced from 12 to eight in 2019, we decided to look only at 2019 and later to see how scores compare in the current system. We looked at the average of nationals scores (both semifinals and finals) and compared them to postseason scoring up to that point (e.g. conference championships and regionals), the full regular season, the last half of the regular season and NQS.
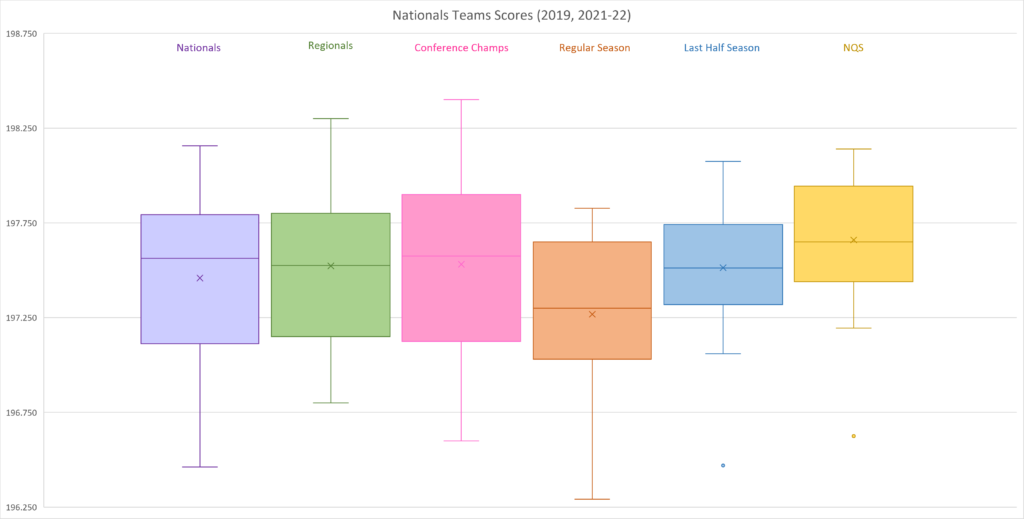
| Average Score | Maximum | Minimum | |
| Nationals | 197.459 | 198.156 | 196.463 |
| Regionals | 197.523 | 198.300 | 196.800 |
| Conference Champs | 197.532 | 198.400 | 196.600 |
| Regular Season | 197.268 | 197.827 | 196.293 |
| Last Half of Season | 197.513 | 198.075 | 196.470 |
| NQS | 197.660 | 198.140 | 196.625 |
From this plot, we can see that nationals scores do trend lower than both regionals and conference championship scores as a whole, slightly lower than the last half of the season and NQSs, but they do look higher than the full regular season.
Looking at the three postseason events, t-tests confirm that there is no significant difference in scoring between them for teams that make the national championship:
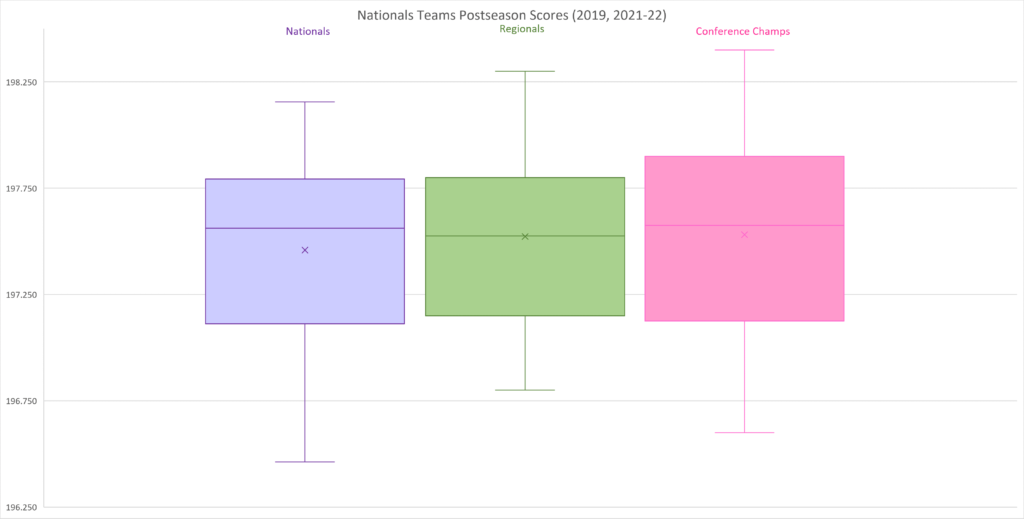
| Average Difference from Nationals | Average Difference from Regionals | |
| Regionals | 0.064 | |
| Conference Champs | 0.073 | 0.009 |
| t-test vs Nationals | t-test vs Regionals | |
| Regionals | 0.316 | |
| Conference Champs | 0.307 | 0.475 |
Because there is no significant difference in scoring, we’ll look only at the difference in scoring between the national championship and regular season:
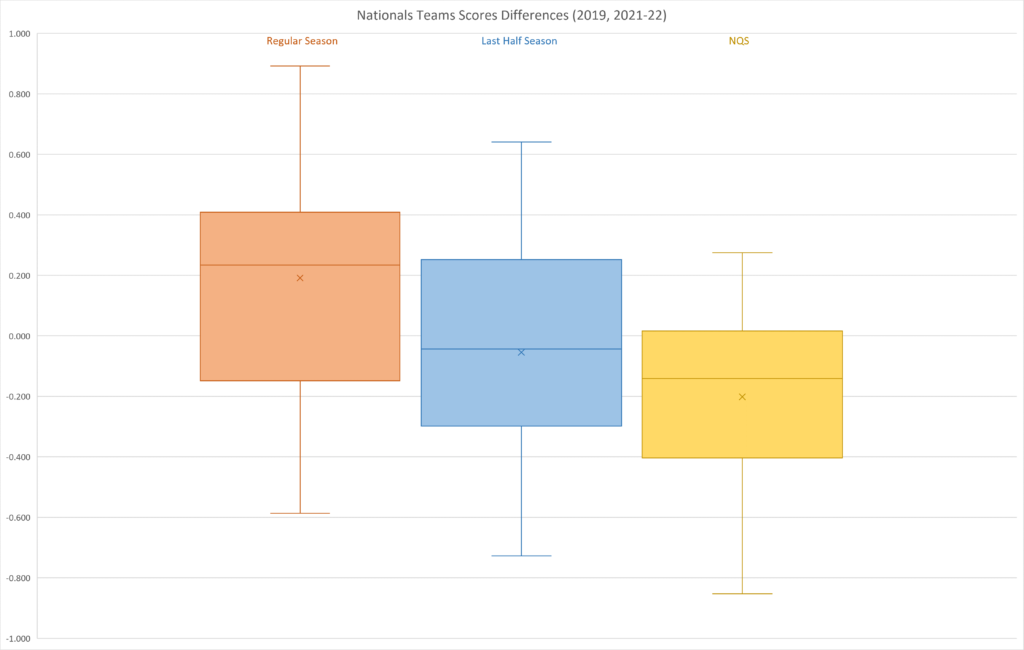
| Average Difference from Nationals | T-test vs Nationals | |
| Regular Season | 0.191 | 0.069 |
| Last Half of Season | -0.055 | 0.328 |
| NQS | -0.201 | 0.054 |
For teams competing at nationals, you can expect their nationals scores to average about 0.201 points lower than their NQS and about 0.191 points higher than their regular season scores.
Additionally, compared to regionals teams as a whole, teams that make nationals scores are a bit closer than all regionals teams when it comes to NQS.
Two of our three t-test scores are very close but not quite below the 0.05 number for our 95 percent confidence interval that nationals scores are different than the regular season metrics, which means that there is no statistically significant difference in nationals scoring compared to the regular season.
It is worth noting that we only have three years of data to look at, which means our sample size is pretty low and our analysis isn’t quite as rigorous, and those almost-but-not-quite t-test scores may become statistically significant as time goes on (unless judges decide to get much stricter moving forward – let us all hope).
Summing It Up
So can we be excited about stricter postseason scoring thanks to the addition of those two or four extra judges?
The short answer: Kind of?
When looking at the 36 teams that make regionals, you can expect regionals scores to be lower than both the last half of the regular season and NQSs, but pretty similar to the season as a whole. When it comes to conference championships, you can expect numbers closer to the last half of the regular season.
So it isn’t the extra judges that make scoring a bit tighter, it’s moving into regionals.
When it comes specifically to teams who make it to the national championship, scoring at nationals is lower than NQS (by 0.201 points) and higher than the regular season as a whole, but those differences aren’t statistically significant…yet. Scoring for the postseason gets slightly lower at each additional stage, but it is only marginally lower.