After the record-breaking 2024 season, there were promises that scores would drop. A new judging analysis system was set up that would compare judges’ scores to scores from a central committee for quality and assignment purposes. That plan lasted about a month. Some coaches didn’t want to participate. Others complained about how their scores were too low.
So–how did things all shake up? There are improvements. Let’s take a look.
First, if you want more info about past years, take a look 25 years of Regionals NQS requirements, which compared 1998 through 2023, and 2024’s update.
Comparing 2021-2025
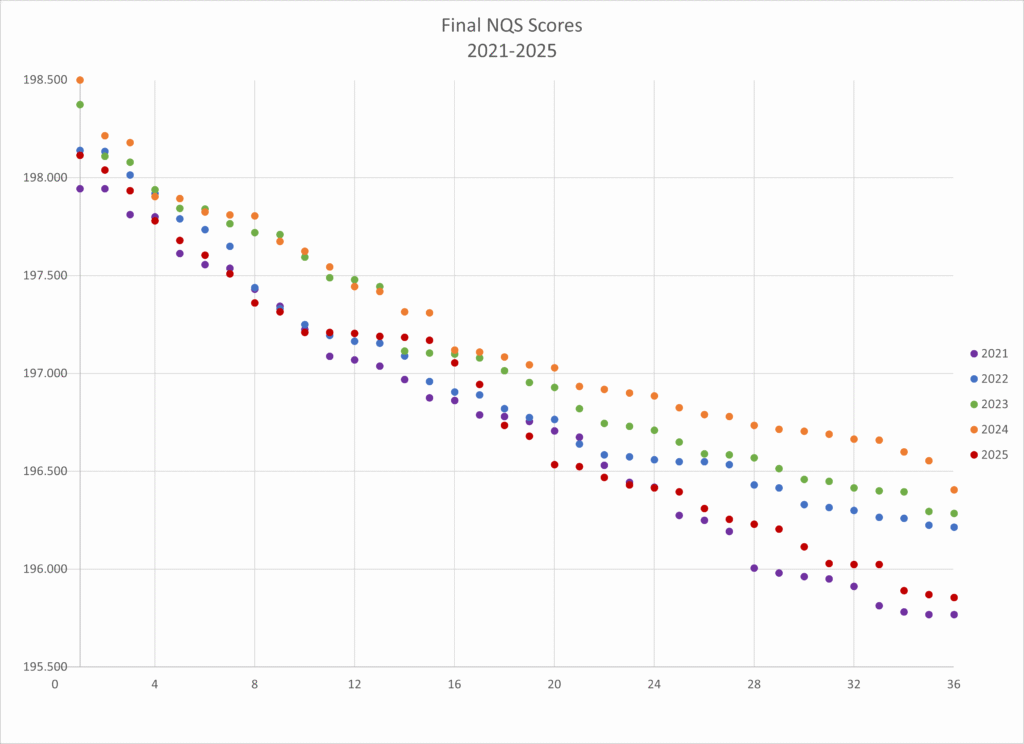
2025’s scores have indeed gone down to around the 2021 level. Let’s look at the specifics.
| Year | Average | Max | Min | Variance |
| 2021 | 196.747 | 197.844 | 195.769 | 0.469 |
| 2022 | 196.941 | 198.140 | 196.215 | 0.349 |
| 2023 | 197.092 | 198.375 | 196.285 | 0.365 |
| 2024 | 197.212 | 198.500 | 196.405 | 0.294 |
| 2025 | 196.820 | 198.115 | 195.855 | 0.452 |
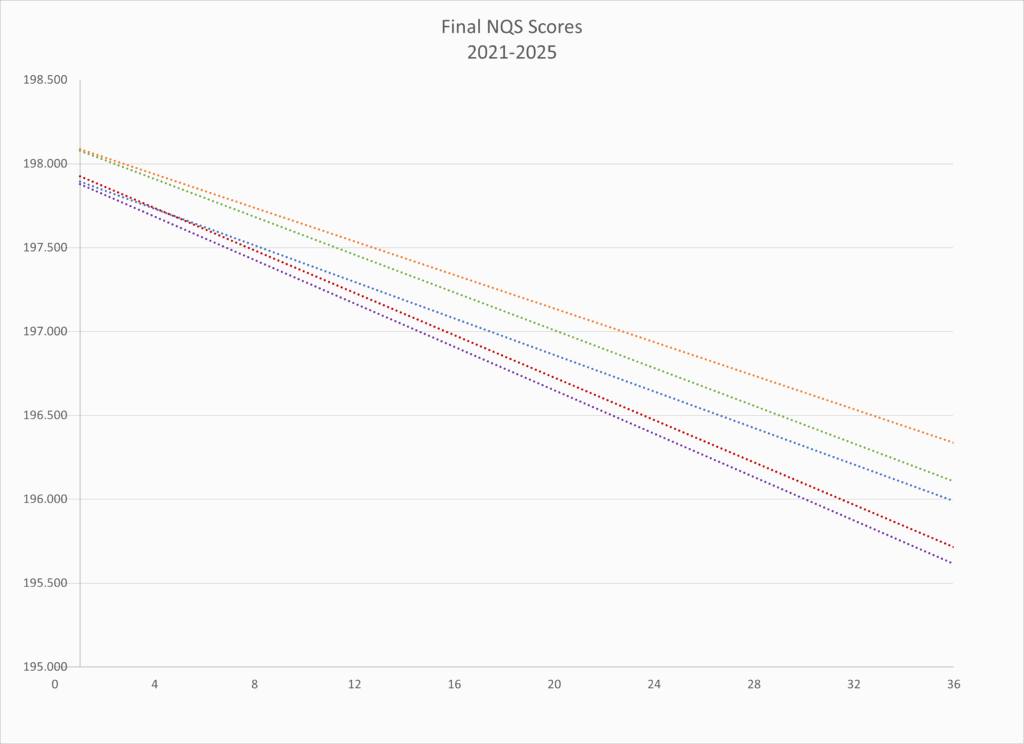
Looking at trend lines, in 2022, the lower half of the bracket saw higher scores than in 2021. But in 2023, everyone saw higher scores. In 2024, the lower ranks saw bigger increases than the higher ranks.
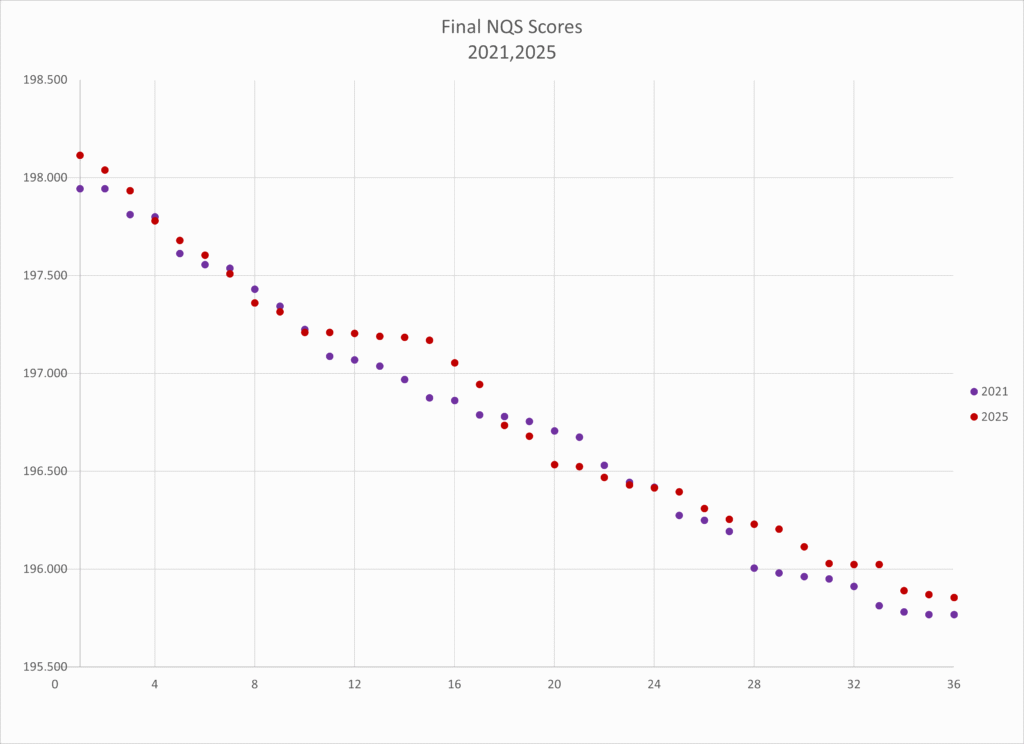
And for the the two-sided t-tests directly comparing two years:
| 2025 | |
| 2021 | 0.6491 |
| 2022 | 0.4186 |
| 2023 | 0.0749 |
| 2024 | 0.0082 |
As you may remember from previous years, when looking at statistics, we generally use p=0.050 as our cutoff to determine whether two data sets can be considered consistent and are looking for numbers that are as high as possible.
When looking at 2025 compared to previous years, the obvious closest year for comparison is 2021 with a 0.6491. 2022 with a 0.4186 is also a very good number, then 2023 is marginal and 2024 is below our p-value threshold.
Comparing Ranks 8-16
The area that interests me most is ranks 8 through 16. The top team tends have unexpected NQS scores (2023 and 2024 were very high, 2021 and 2022 were very close to second), but the remainder of the top 8 and bottom 16 look like you’d expect with generally straight lines down. 2021 and 2025, as expected, have lower bottom end scores than in the other three years because that’s where most of the difference in NQS scores can be seen. Ranks 8 through 16, however, have a less linear pattern.
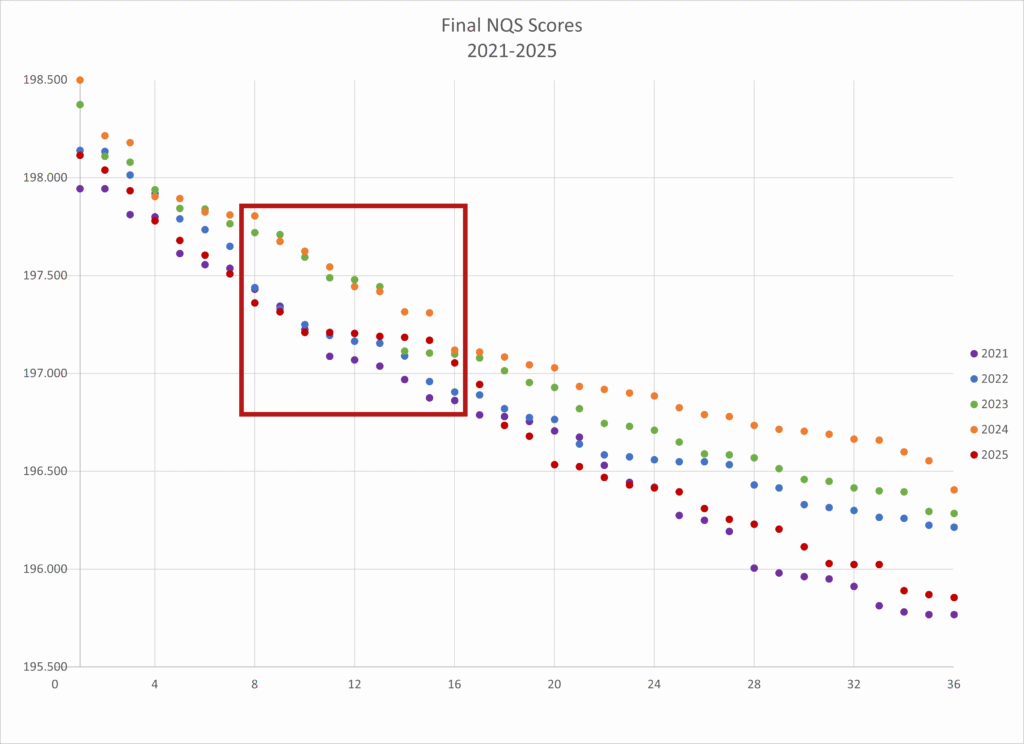
Zooming in:
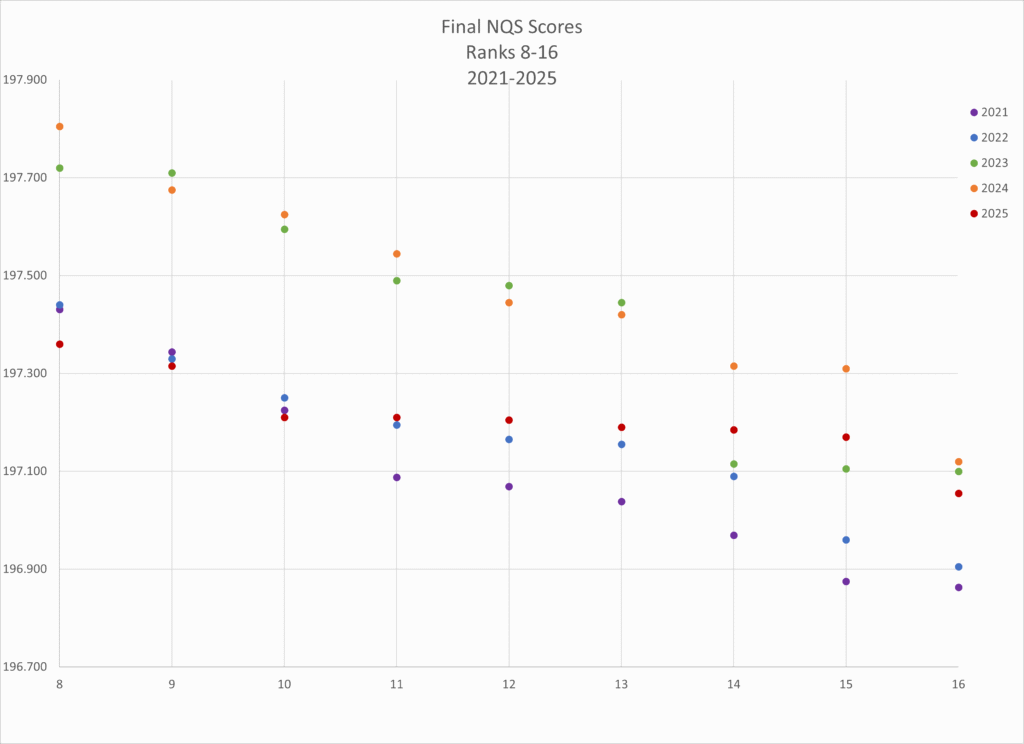
Visually, this is where the scores start to lump up or have a major jump in most years.
In 2023, we saw ranks 11 through 13 clumped together with a range of 0.045 (197.490 – 197.445) then a massive drop of 0.330 for rank 14, followed by another clump at 14 through 16, with a range of only 0.015 (197.115 – 197.100).
Similarly, in 2025, ranks 10 through 15 have a spread of only 0.040 (197.210 – 197.170). That is a difference of less than one judge giving a 9.85 or a 9.90 on a routine each meet.
I could make several guesses why this happens. It’s probably multiple factors. It’s just very interesting to consider when it comes to regionals and those last 8-16 ranks being the last seeded ranks and even one spot up or down could make a big difference in which two top 8 teams you have to compete against (and upset).
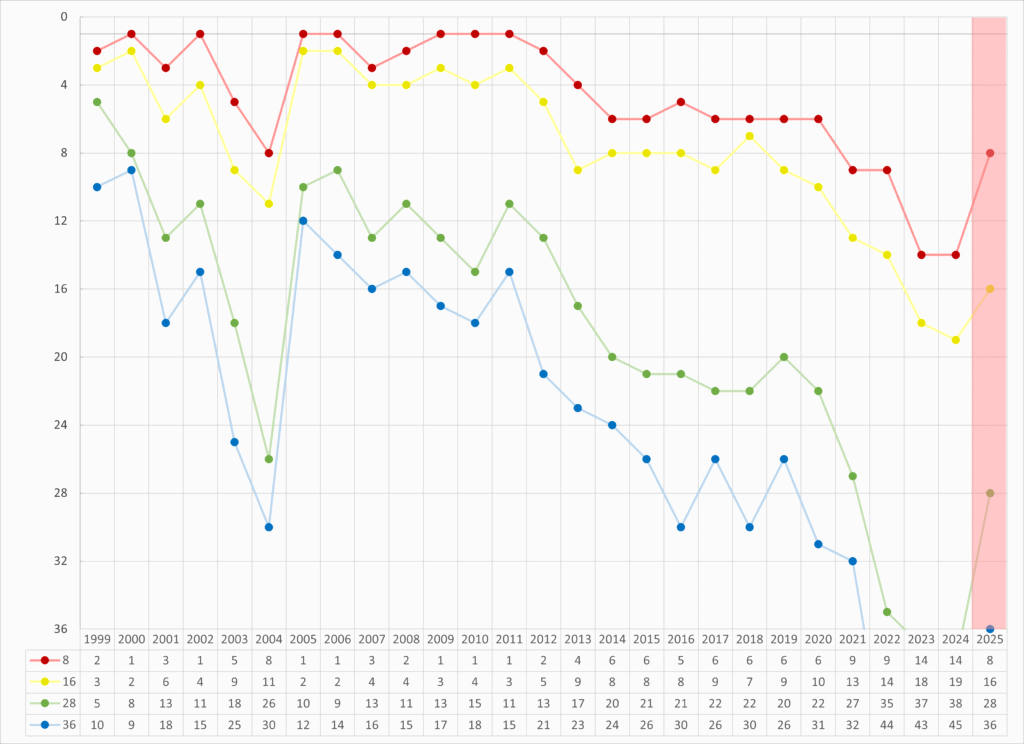
Rank Equivalencies
Next I looked at where 2025’s rank 8, 16 (a seeded spot), 28 (no play-in) and 36 (regionals) would rank each year since 1999.
And at NQS requirements for each rank in 2021, 2024 and 2025:
| Rank | 2021 NQS (vs 2025) | 2024 NQS (vs 2025) | 2025 NQS |
| 8 | 197.431 (+0.071) | 197.805 (+0.445) | 197.360 |
| 16 | 196.863 (-0.192) | 197.120 (+0.065) | 197.055 |
| 28 | 196.006 (-0.224) | 196.735 (+0.505) | 196.230 |
| 36 | 195.769 (-0.086) | 196.405 (+0.550) | 195.855 |
The biggest difference between 2021 and 2025 is that ranks 16 and 28 are higher in 2025 but ranks 8 and 36 are both lower. Rank 16 is closest in 2025 and 2024, but is consistently about half a point higher in the other three ranks.