
With the new season comes a new method of calculating NQS. The new system is designed to take into account more meets to provide a more accurate representation of how a team performed throughout the season instead of just incorporating the six top scores.
The new calculations must include at least nine meets, with at least five of those meets being away meets and a maximum of five being home meets. Any additional home meets will be excluded from the calculation, with the highest home score being dropped.
There is a second new rule, dubbed (by me) the Maverik Center Rule, where only one neutral site meet within 30 miles of a team’s campus will be counted as an away meet. All remaining neutral site meets will count as home meets. There is no indication yet which neutral site meet gets to count as the away meet, but this ultimately won’t matter with the new NQS because all but three meets will be counted anyway, and if a team’s top score is in January, they have bigger problems than home vs away scores.
The Calculations
Old NQS
Let’s use Utah in 2025 as our example for counting both NQS scores:
| 196.775 | H |
| 196.800 | A |
| 197.300 | H |
| 197.950* | A (Maverik) |
| 196.975 | A |
| 197.425* | A |
| 197.675* | H |
| 196.600 | A |
| 198.075* | H |
| 197.225 | A |
| 198.100* | H |
| 197.775* | A |
With the old calculation, these are the top six scores:
198.100
198.075
197.950
197.775
197.675
197.425
The highest score will be removed and the five remaining will be averaged, for an NQS score of 197.780.
New NQS
In this case, we will take all scores sorted from highest to lowest:198.100 H
198.075 H
197.950 A
197.775 A
197.675 H
197.425 A
197.300 H
197.225 A
196.975 A
196.800 A
196.775 H196.600 A
The top and bottom scores are removed. The remaining ten meets are averaged for an NQS score of 197.398, with a difference between the new and old NQS scores of 0.458.
Comparing the Top 16
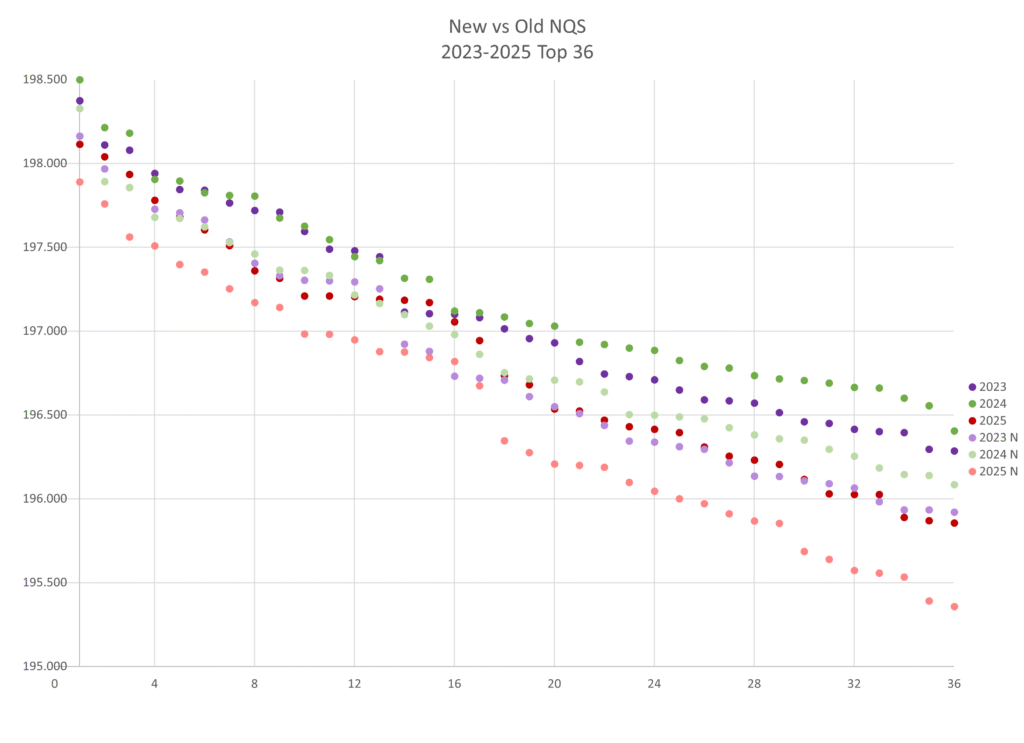
So how do the new vs old calculations change NQS scores and rankings? I looked at 2023 through 2025 (because those are the three years my NQS spreadsheet hadn’t changed too much to just copy-paste the numbers over and I am too lazy to manually add new numbers). I have sorted the top 16 by both the new and the old NQS rankings so you can compare based on whichever metric you’d like, and I have included a chart with the top 36 teams that would have made regionals based on the new metrics.
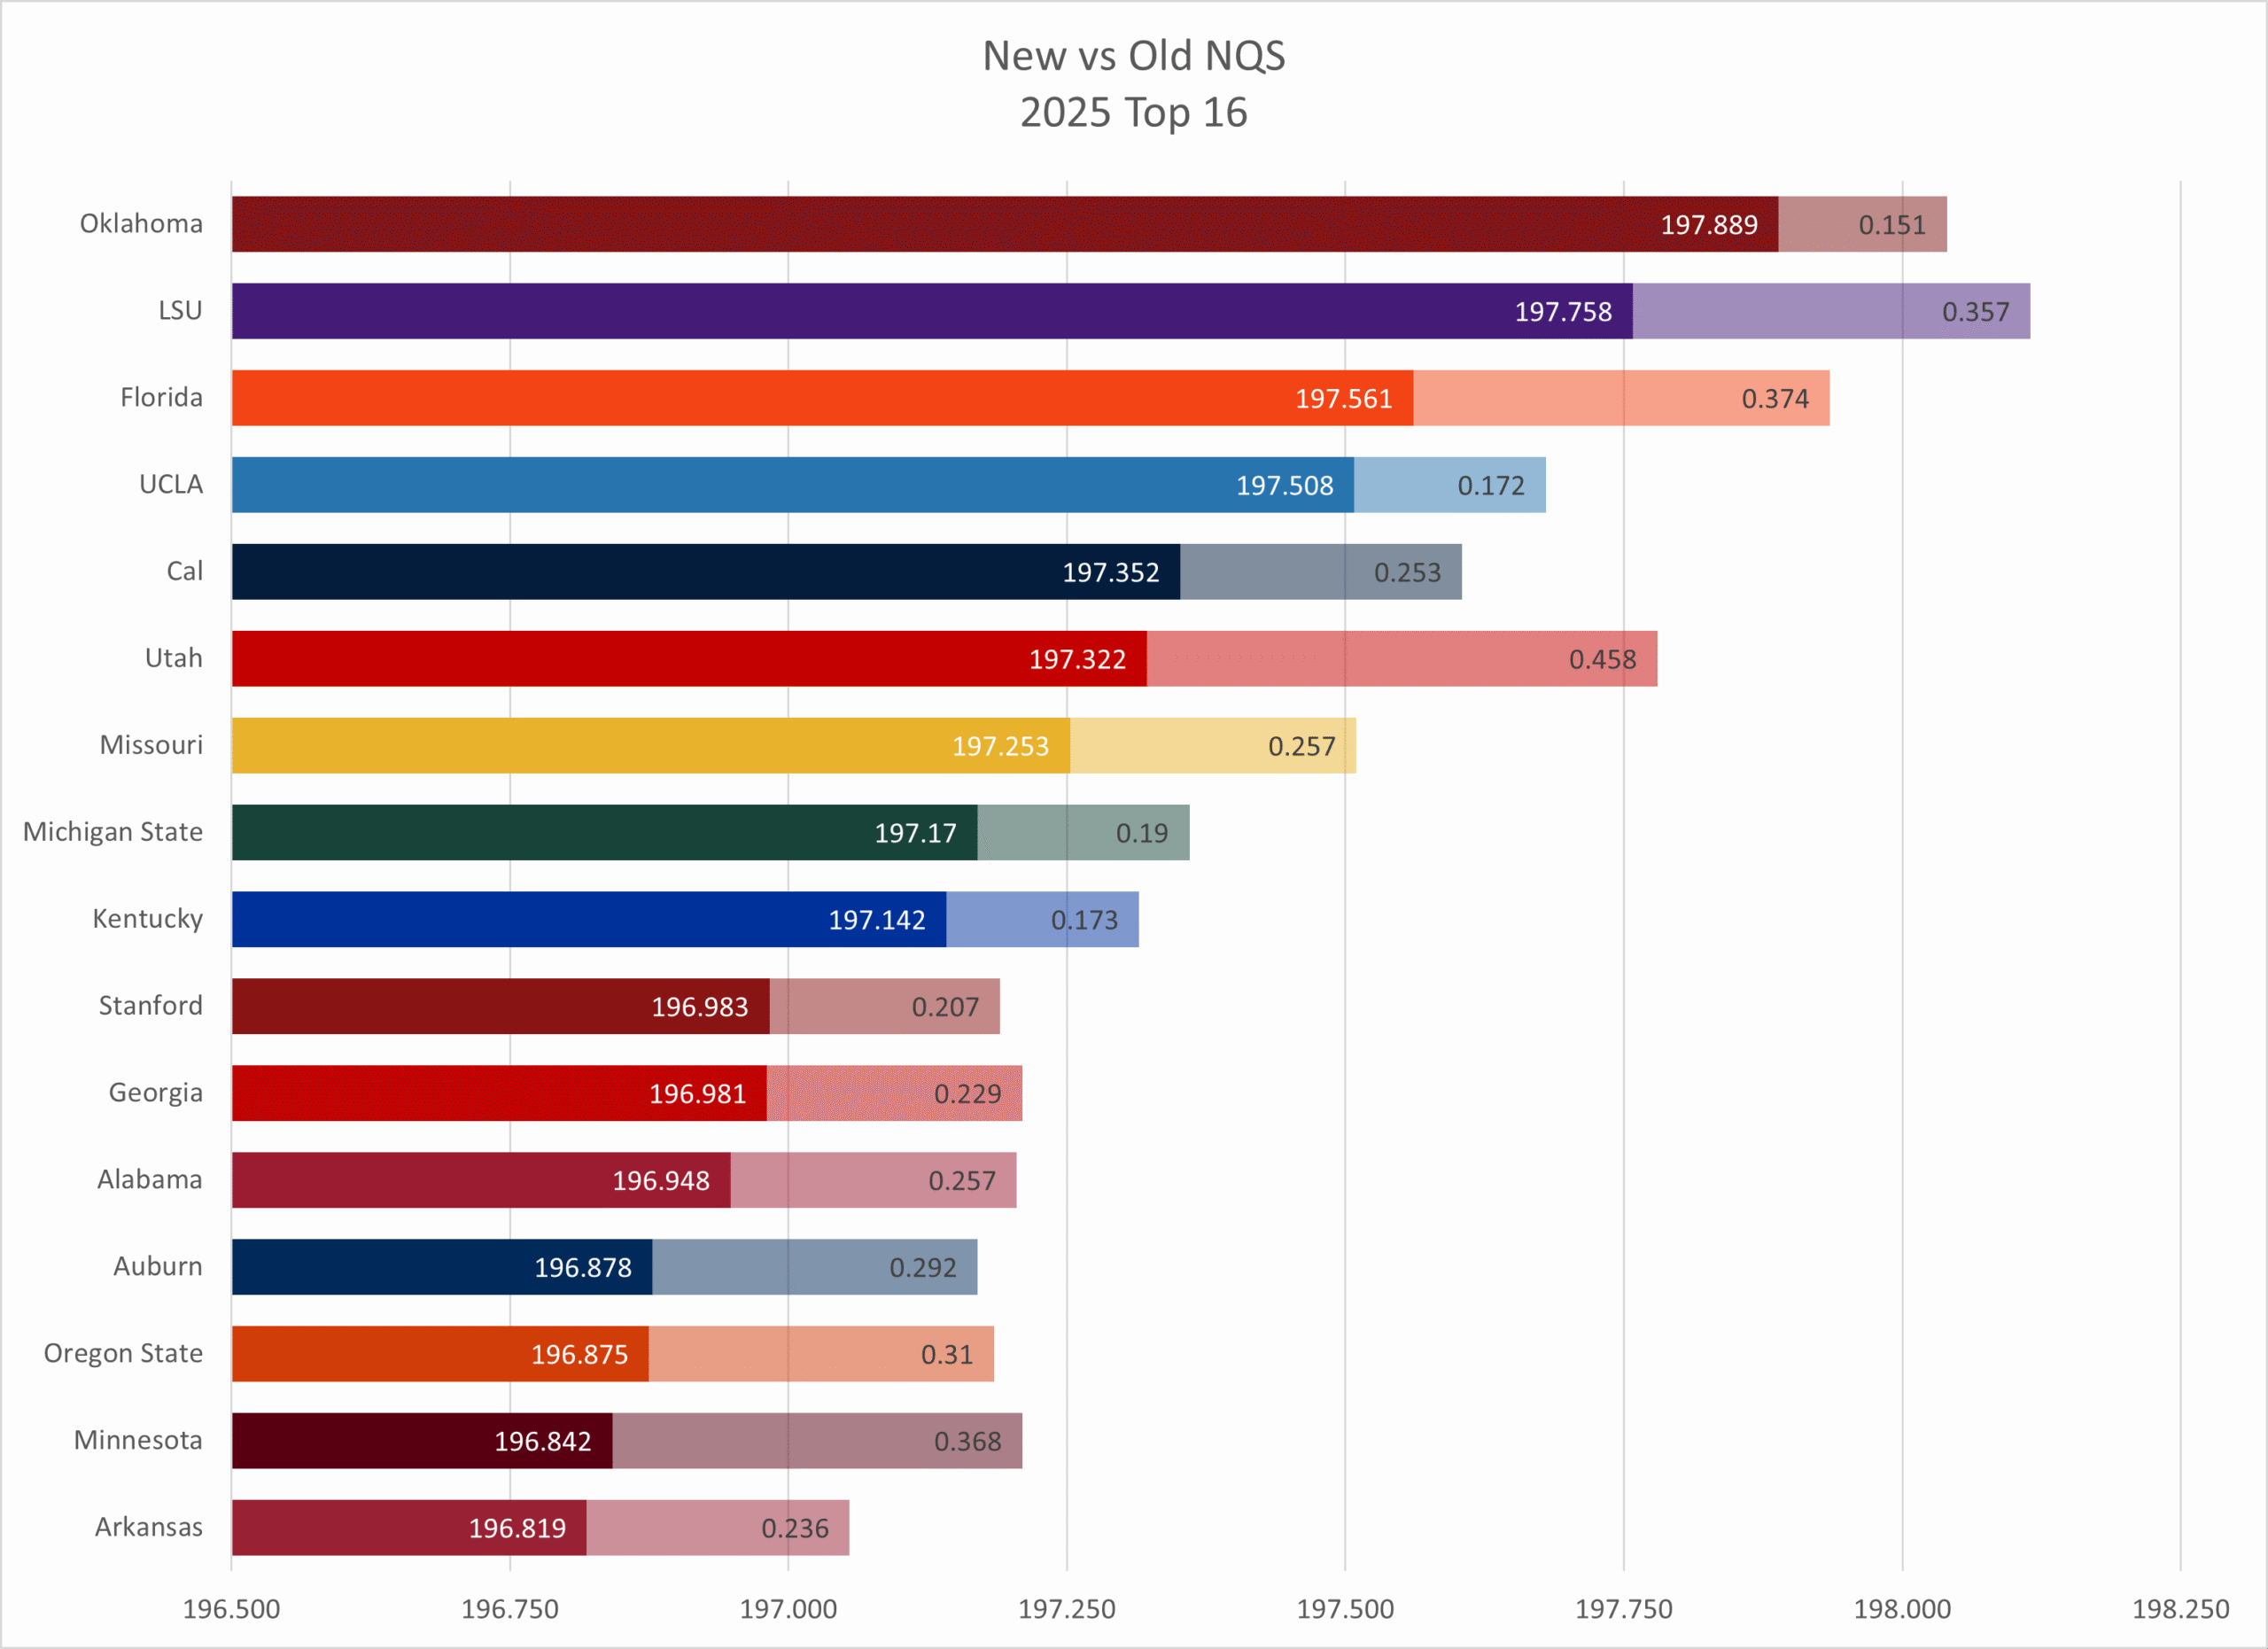
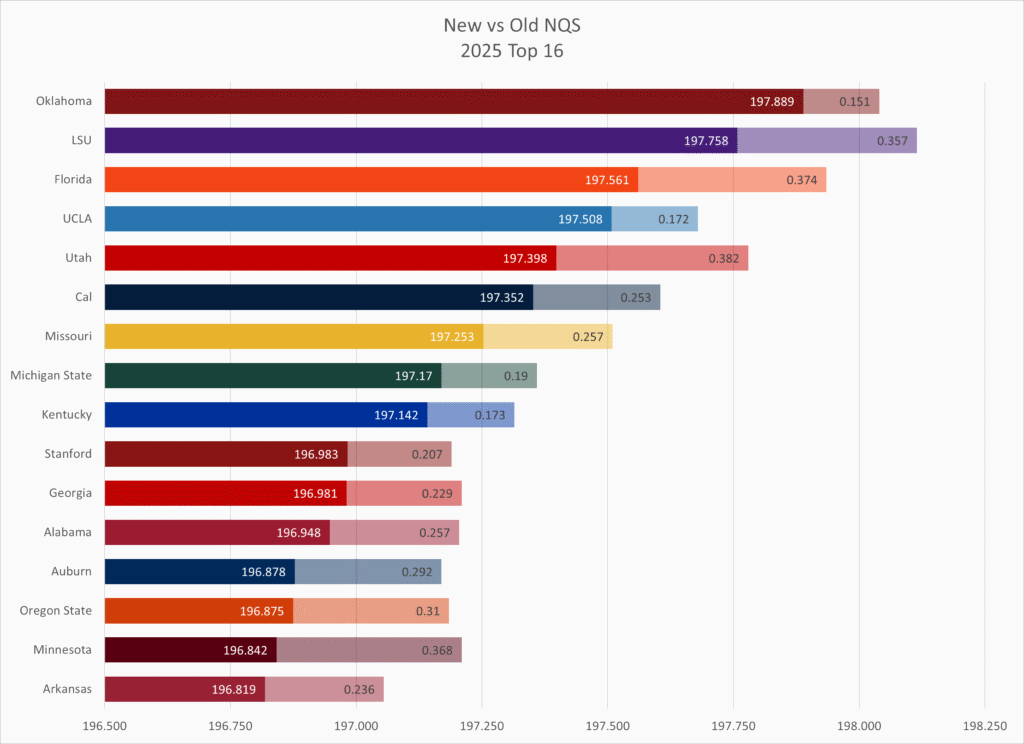
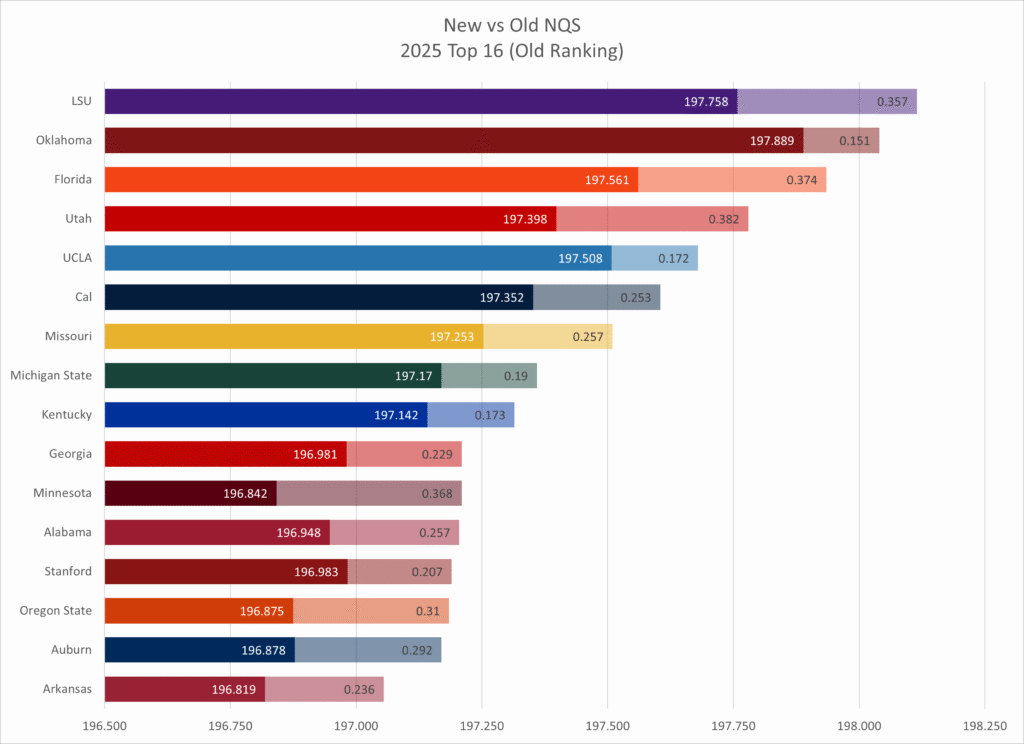
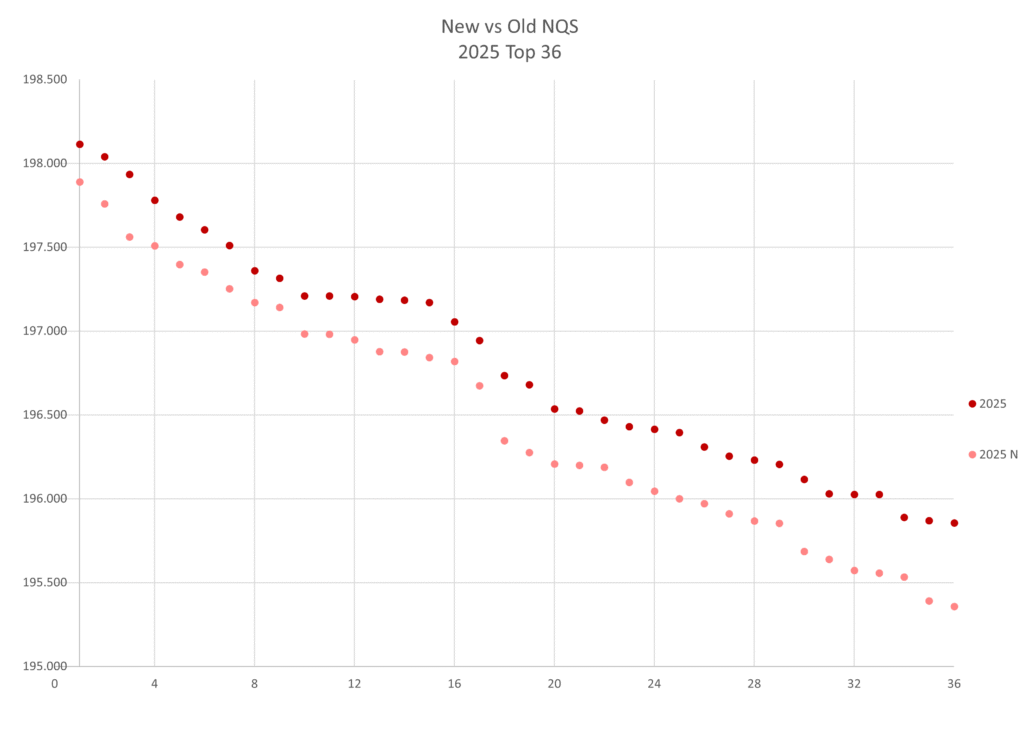
2025
| New Rank | School | New NQS | Old NQS | Difference | Old Rank | Rank Change |
| 1 | Oklahoma | 197.889 | 198.04 | -0.151 | 2 | 1 |
| 2 | LSU | 197.758 | 198.115 | -0.357 | 1 | -1 |
| 3 | Florida | 197.561 | 197.935 | -0.374 | 3 | 0 |
| 4 | UCLA | 197.508 | 197.68 | -0.172 | 5 | 1 |
| 5 | Utah | 197.398 | 197.780 | -0.382 | 4 | -1 |
| 6 | Cal | 197.352 | 197.605 | -0.253 | 6 | 0 |
| 7 | Missouri | 197.253 | 197.51 | -0.257 | 7 | 0 |
| 8 | Michigan State | 197.17 | 197.36 | -0.19 | 8 | 0 |
| 9 | Kentucky | 197.142 | 197.315 | -0.173 | 9 | 0 |
| 10 | Stanford | 196.983 | 197.19 | -0.207 | 13 | 3 |
| 11 | Georgia | 196.981 | 197.21 | -0.229 | 10 | -1 |
| 12 | Alabama | 196.948 | 197.205 | -0.257 | 12 | 0 |
| 13 | Auburn | 196.878 | 197.17 | -0.292 | 15 | 2 |
| 14 | Oregon State | 196.875 | 197.185 | -0.31 | 14 | 0 |
| 15 | Minnesota | 196.842 | 197.21 | -0.368 | 10 | -5 |
| 16 | Arkansas | 196.819 | 197.055 | -0.236 | 16 | 0 |
| 17 | Michigan | 196.675 | 196.945 | -0.27 | 17 | 0 |
| 18 | Denver | 196.347 | 196.735 | -0.388 | 18 | 0 |
| 19 | NC State | 196.275 | 196.68 | -0.405 | 19 | 0 |
| 20 | Nebraska | 196.208 | 196.535 | -0.327 | 20 | 0 |
| 21 | Ohio State | 196.2 | 196.395 | -0.195 | 25 | 4 |
| 22 | Arizona | 196.188 | 196.525 | -0.337 | 21 | -1 |
| 23 | North Carolina | 196.098 | 196.47 | -0.372 | 22 | -1 |
| 24 | ASU | 196.045 | 196.31 | -0.265 | 26 | 2 |
| 25 | SUU | 196 | 196.415 | -0.415 | 24 | -1 |
| 26 | Clemson | 195.972 | 196.255 | -0.283 | 27 | 1 |
| 27 | Penn State | 195.91 | 196.23 | -0.32 | 28 | 1 |
| 28 | Iowa | 195.868 | 196.43 | -0.562 | 23 | -5 |
| 29 | Boise State | 195.853 | 196.115 | -0.262 | 30 | 1 |
| 30 | Maryland | 195.686 | 196.03 | -0.344 | 31 | 1 |
| 31 | Illinois | 195.639 | 196.205 | -0.566 | 29 | -2 |
| 32 | BYU | 195.573 | 196.025 | -0.452 | 32 | 0 |
| 33 | Utah State | 195.557 | 196.025 | -0.468 | 33 | 0 |
| 34 | Towson | 195.533 | 195.835 | -0.302 | 37 | 3 |
| 35 | George Washington | 195.391 | 195.675 | -0.284 | 42 | 7 |
| 36 | Washington | 195.358 | 195.77 | -0.412 | 38 | 2 |
We see some movement in the top 16 seeded positions, but there are no teams that would fall out of those top 16. Looking more closely, the top 8 that would get the top two seeds at regionals remain within the top 8.
Towson, George Washington and Washington would make regionals under the new metric, replacing Rutgers, UC Davis and West Virginia, who made it last season. George Washington increased their rank by a whopping 7 spaces.
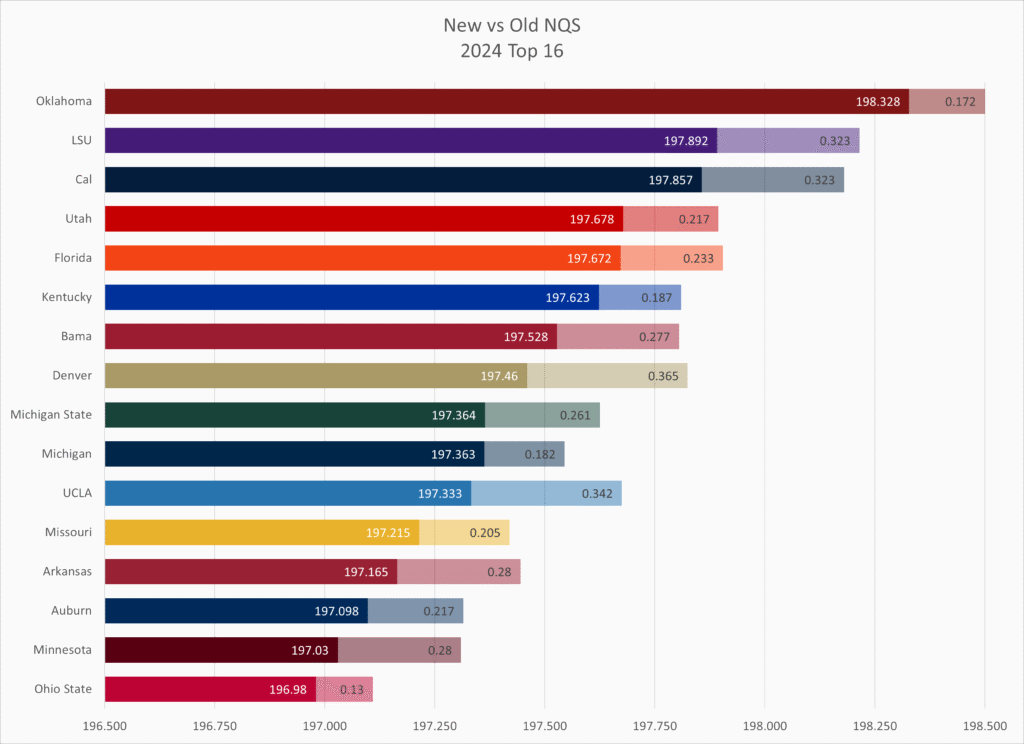
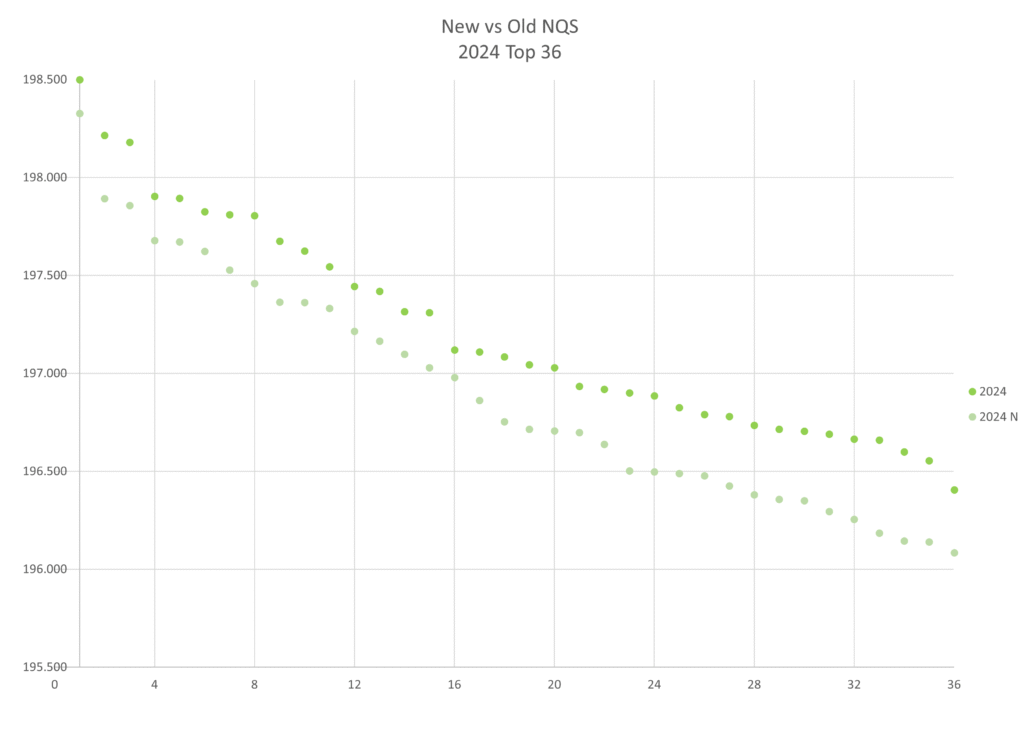
2024
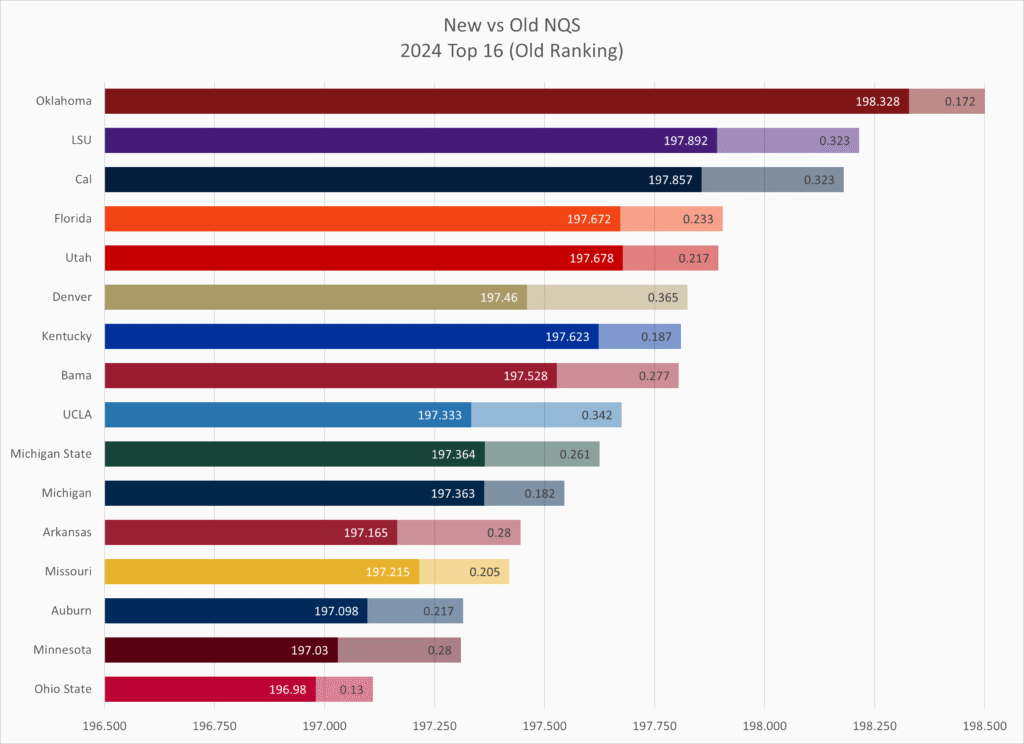
| New Rank | School | New NQS | Old NQS | Difference | Old Rank | Rank Change |
| 1 | Oklahoma | 198.328 | 198.500 | -0.172 | 1 | 0 |
| 2 | LSU | 197.892 | 198.215 | -0.323 | 2 | 0 |
| 3 | Cal | 197.857 | 198.180 | -0.323 | 3 | 0 |
| 4 | Utah | 197.678 | 197.895 | -0.217 | 5 | 1 |
| 5 | Florida | 197.672 | 197.905 | -0.233 | 4 | -1 |
| 6 | Kentucky | 197.623 | 197.810 | -0.187 | 7 | 1 |
| 7 | Bama | 197.528 | 197.805 | -0.277 | 8 | 1 |
| 8 | Denver | 197.460 | 197.825 | -0.365 | 6 | -2 |
| 9 | Michigan State | 197.364 | 197.625 | -0.261 | 10 | 1 |
| 10 | Michigan | 197.363 | 197.545 | -0.182 | 11 | 1 |
| 11 | UCLA | 197.333 | 197.675 | -0.342 | 9 | -2 |
| 12 | Missouri | 197.215 | 197.420 | -0.205 | 13 | 1 |
| 13 | Arkansas | 197.165 | 197.445 | -0.280 | 12 | -1 |
| 14 | Auburn | 197.098 | 197.315 | -0.217 | 14 | 0 |
| 15 | Minnesota | 197.030 | 197.310 | -0.280 | 15 | 0 |
| 16 | Ohio State | 196.980 | 197.110 | -0.130 | 17 | 1 |
| 17 | Oregon State | 196.863 | 197.085 | -0.222 | 18 | 1 |
| 18 | Georgia | 196.753 | 197.030 | -0.277 | 20 | 2 |
| 19 | Stanford | 196.715 | 197.045 | -0.330 | 19 | 0 |
| 20 | NC State | 196.707 | 197.120 | -0.413 | 16 | -4 |
| 21 | Arizona State | 196.698 | 196.920 | -0.222 | 22 | 1 |
| 22 | Arizona | 196.638 | 196.885 | -0.247 | 24 | 2 |
| 23 | Penn State | 196.502 | 196.825 | -0.323 | 25 | 2 |
| 24 | Washington | 196.498 | 196.735 | -0.237 | 28 | 4 |
| 25 | Clemson | 196.489 | 196.705 | -0.216 | 30 | 5 |
| 26 | Boise State | 196.478 | 196.715 | -0.237 | 29 | 3 |
| 27 | Nebraska | 196.425 | 196.780 | -0.355 | 27 | 0 |
| 28 | Illinois | 196.381 | 196.690 | -0.309 | 31 | 3 |
| 29 | BYU | 196.357 | 196.665 | -0.308 | 32 | 3 |
| 30 | Maryland | 196.350 | 196.790 | -0.440 | 26 | -4 |
| 31 | Towson | 196.296 | 196.935 | -0.639 | 21 | -10 |
| 32 | Ball State | 196.255 | 196.600 | -0.345 | 35 | 3 |
| 33 | Kent State | 196.185 | 196.900 | -0.715 | 23 | -10 |
| 34 | San Jose State | 196.145 | 196.555 | -0.410 | 36 | 2 |
| 35 | SUU | 196.139 | 196.660 | -0.521 | 33 | -2 |
| 36 | Iowa | 196.085 | 196.305 | -0.220 | 37 | 1 |
Notably, NC State falls out of the top 16 seeded spots and is replaced by Ohio State for the 16th. Again, we see some movement within the top 8, but there is no movement between the top 8 and the next 8.
Iowa replaces Iowa State as the last team to make regionals.
Kent State and Towson both fell by 10 slots, with Kent State showing the downside of having to count one or two very low outliers (they had two meets in the low 194s while the rest were 195s to low 197s), and Towson showing the downside of having a lot of meets (14 meets total) with a wide range of scores that didn’t count under the old NQS system but are now taken into account.
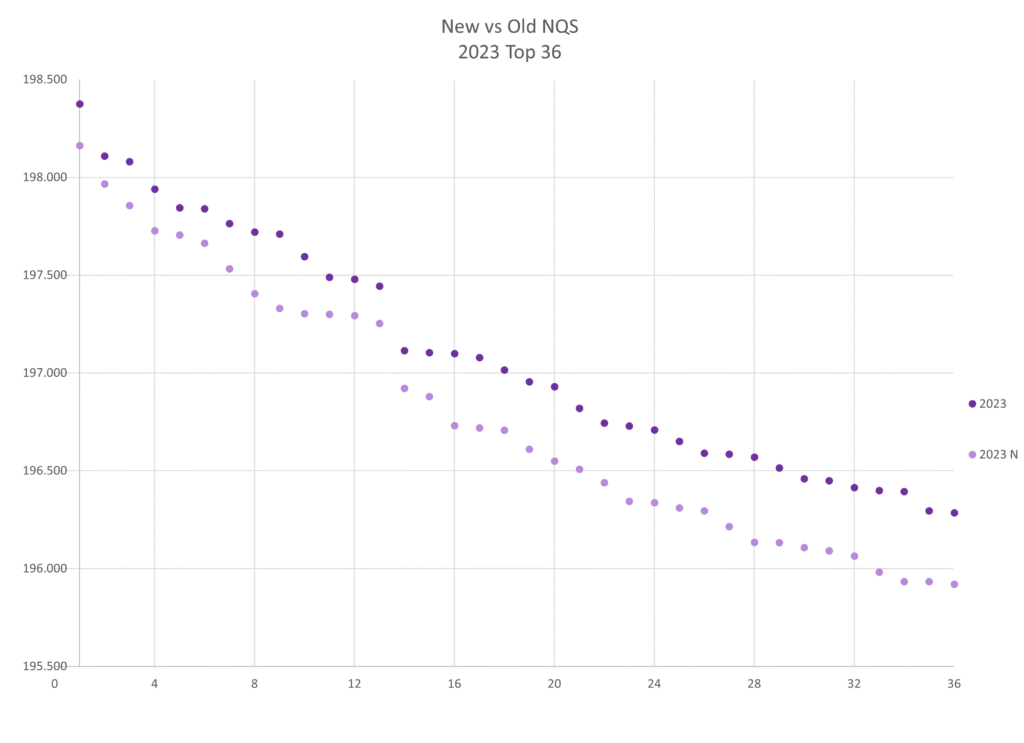
2023
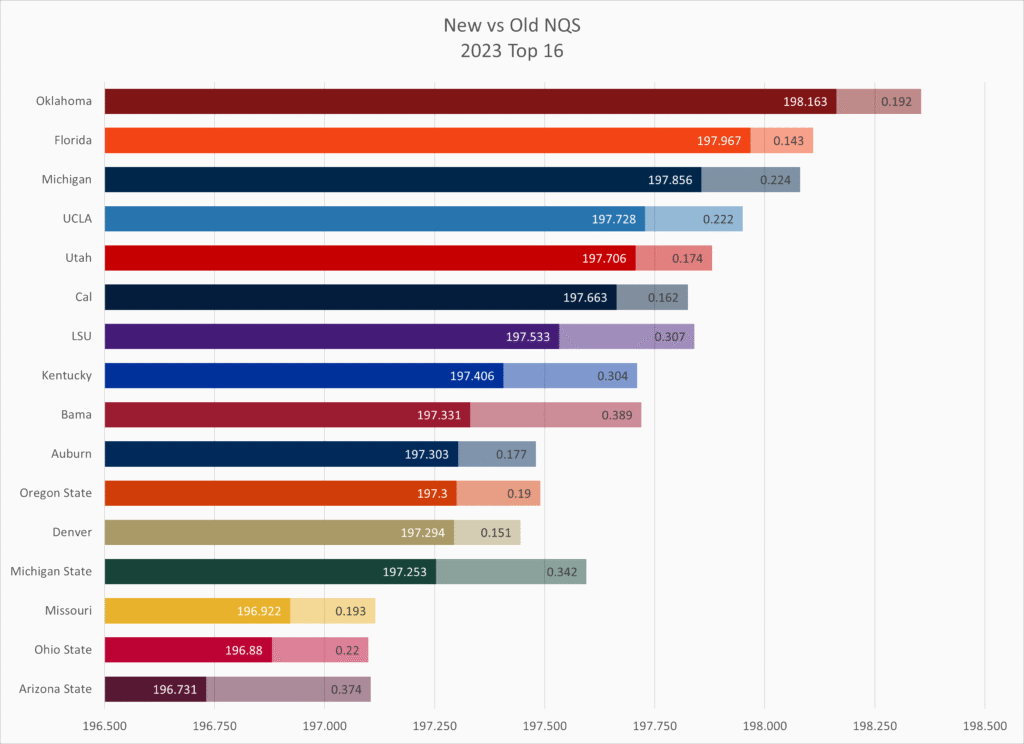
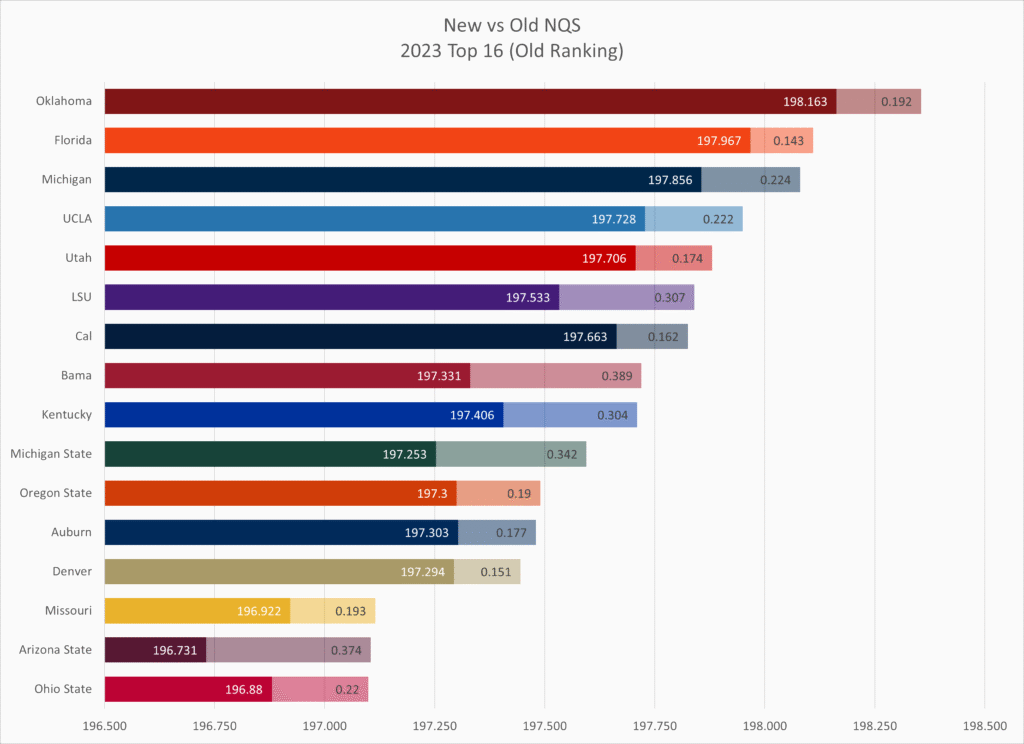
| New Rank | School | New | Old | Difference | Old Rank | Rank Change |
| 1 | Oklahoma | 198.163 | 198.355 | -0.192 | 1 | 0 |
| 2 | Florida | 197.967 | 198.110 | -0.143 | 2 | 0 |
| 3 | Michigan | 197.856 | 198.080 | -0.224 | 3 | 0 |
| 4 | UCLA | 197.728 | 197.950 | -0.222 | 4 | 0 |
| 5 | Utah | 197.706 | 197.880 | -0.174 | 5 | 0 |
| 6 | Cal | 197.663 | 197.825 | -0.162 | 7 | 1 |
| 7 | LSU | 197.533 | 197.840 | -0.307 | 6 | -1 |
| 8 | Kentucky | 197.406 | 197.710 | -0.304 | 9 | 1 |
| 9 | Bama | 197.331 | 197.720 | -0.389 | 8 | -1 |
| 10 | Auburn | 197.303 | 197.480 | -0.177 | 12 | 2 |
| 11 | Oregon State | 197.300 | 197.490 | -0.190 | 11 | 0 |
| 12 | Denver | 197.294 | 197.445 | -0.151 | 13 | 1 |
| 13 | Michigan State | 197.253 | 197.595 | -0.342 | 10 | -3 |
| 14 | Missouri | 196.922 | 197.115 | -0.193 | 14 | 0 |
| 15 | Ohio State | 196.880 | 197.100 | -0.220 | 16 | 1 |
| 16 | Arizona State | 196.731 | 197.105 | -0.374 | 15 | -1 |
| 17 | Arkansas | 196.719 | 197.080 | -0.361 | 17 | 0 |
| 18 | Minnesota | 196.708 | 197.015 | -0.307 | 18 | 0 |
| 19 | Georgia | 196.610 | 196.955 | -0.345 | 19 | 0 |
| 20 | Stanford | 196.550 | 196.930 | -0.380 | 20 | 0 |
| 21 | Illinois | 196.508 | 196.745 | -0.237 | 22 | 1 |
| 22 | Iowa | 196.439 | 196.650 | -0.211 | 25 | 3 |
| 23 | NC State | 196.344 | 196.455 | -0.111 | 30 | 7 |
| 24 | SUU | 196.338 | 196.820 | -0.482 | 21 | -3 |
| 25 | Maryland | 196.311 | 196.710 | -0.399 | 24 | -1 |
| 26 | Washington | 196.295 | 196.585 | -0.290 | 27 | 1 |
| 27 | Arizona | 196.215 | 196.570 | -0.355 | 28 | 1 |
| 28 | Ball State | 196.135 | 196.395 | -0.260 | 34 | 6 |
| 29 | Penn State | 196.108 | 196.450 | -0.342 | 32 | 3 |
| 30 | Towson | 196.100 | 196.415 | -0.315 | 31 | 1 |
| 31 | Nebraska | 196.091 | 196.730 | -0.639 | 23 | -8 |
| 32 | Western Michigan | 196.064 | 196.590 | -0.526 | 26 | -6 |
| 33 | North Carolina | 195.983 | 196.295 | -0.312 | 35 | 2 |
| 34 | Boise State | 195.934 | 196.285 | -0.351 | 36 | 2 |
| 35 | West Virginia | 195.934 | 196.515 | -0.581 | 29 | -6 |
| 36 | BYU | 195.920 | 196.400 | -0.480 | 33 | -3 |
This year, we wouldn’t see any teams joining or leaving the top 16 seeded spots, but there is quite a bit of small movement between seeded teams. We also didn’t see any teams drop out of regional inclusion.
NC State saw the biggest rankings increase, and the benefit of the new metrics for some teams – they had one low outlier meet and were pretty consistent score-wise otherwise.
Averages
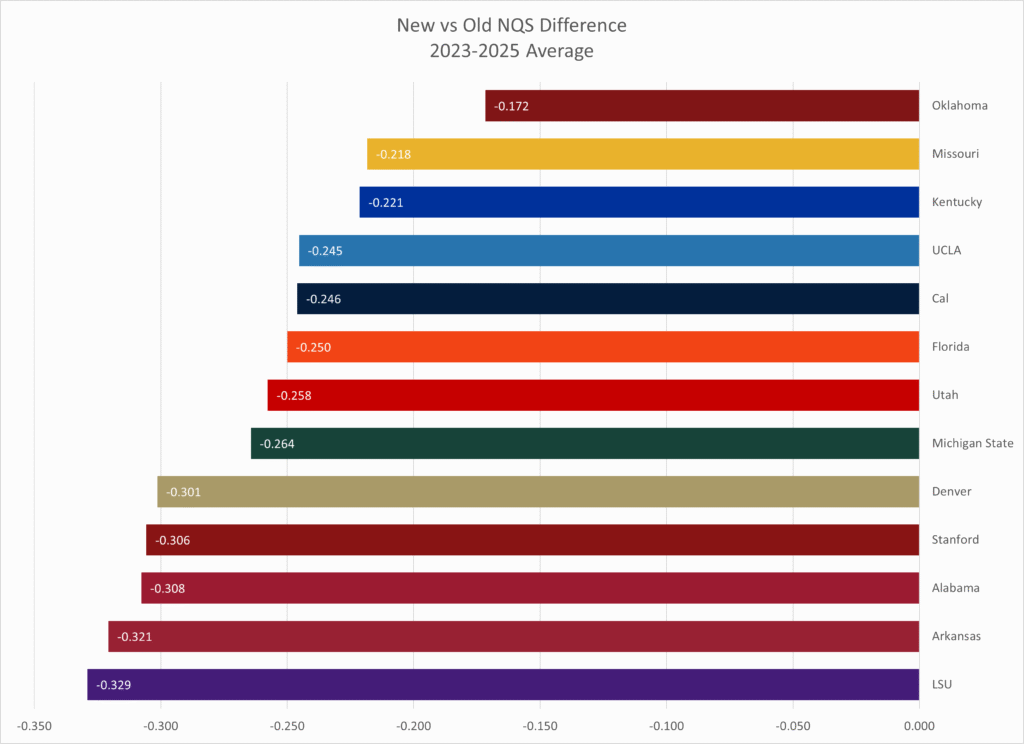
And looking at the averages of the teams that made it to nationals over the last three years.
Comparing to Past Years
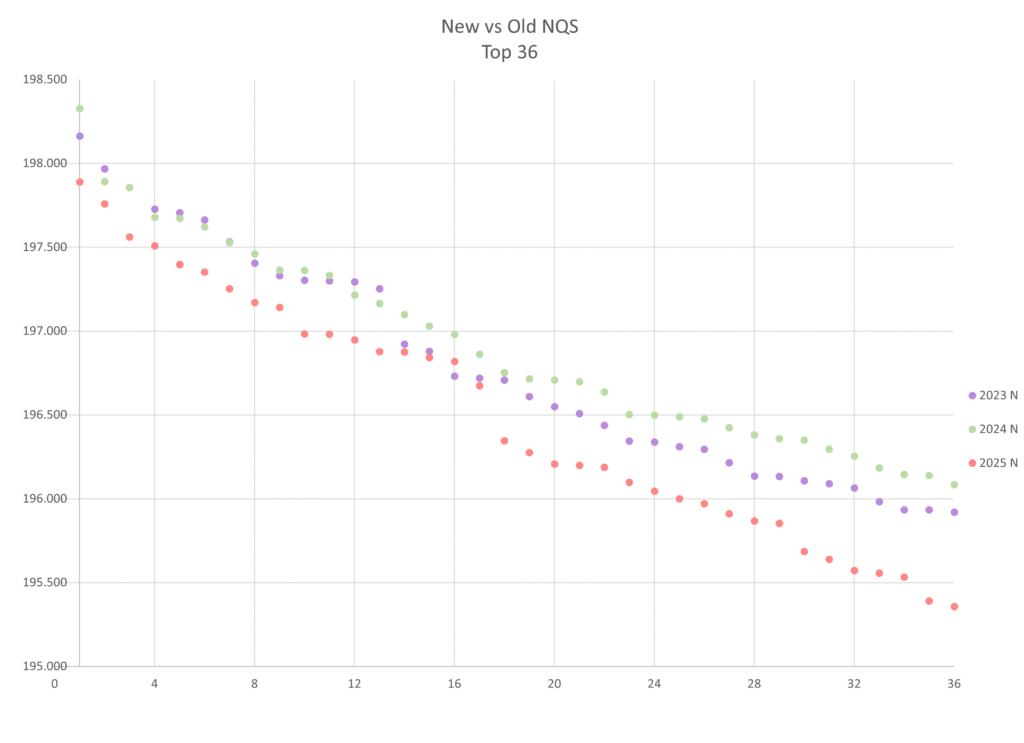
Now let’s look at my beloved scatterplots.
| Year | Average | Max | Min | Variance |
| 2023 | 197.092 | 198.375 | 196.285 | 0.365 |
| 2023 N | 196.788 | 198.163 | 195.920 | 0.453 |
| 0.302 | 0.212 | 0.365 | ||
| 2024 | 197.212 | 198.500 | 196.405 | 0.294 |
| 2024 N | 196.904 | 198.328 | 196.085 | 0.351 |
| 0.308 | 0.172 | 0.320 | ||
| 2025 | 196.820 | 198.115 | 195.855 | 0.452 |
| 2025 N | 196.492 | 197.889 | 195.358 | 0.538 |
| 0.328 | 0.226 | 0.497 |
Over the last three years, the average difference has been about 0.30, with the maximum seeing a smaller decrease compared to the minimum (which is to be expected – top teams will have more consistency in their scores than teams on the edge of making regionals).
Looking at the two-sided t-tests directly comparing two years:
| 2023 N | 2024 N | 2025 N | |
| 2020 | 0.0936 | 0.0125 | 0.8928 |
| 2021 | 0.7952 | 0.3002 | 0.1335 |
| 2022 | 0.3098 | 0.7919 | 0.0057 |
| 2023 | 0.0478 | 0.1870 | 0.0000 |
| 2024 | 0.0045 | 0.0245 | 0.0000 |
| 2025 | 0.8437 | 0.5736 | 0.0526 |
| 2024 N | 0.4410 | ||
| 2025 N | 0.0792 | 0.0109 |
(As you may remember from previous years, when looking at statistics, we generally use p=0.050 as our cutoff to determine whether two data sets can be considered consistent and are looking for numbers that are as high as possible.)
From past analyses*, we know that NQS scores have increased every year this decade until we saw a decrease in 2025, with 2025 dropping down to 2021 levels. It looks like these new NQS scores also drop us down in scores by a couple of years, with 2025’s new NQS being closest to 2020’s old NQS, new 2024 and 2022 being most similar, and new 2023 and 2021 being most similar.
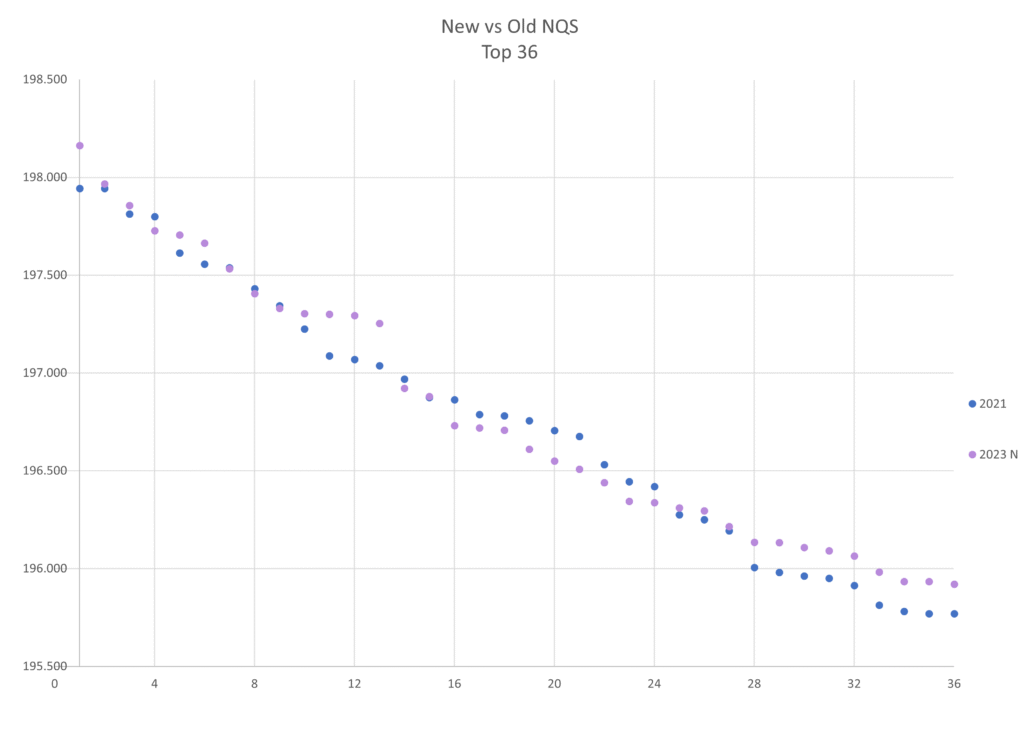
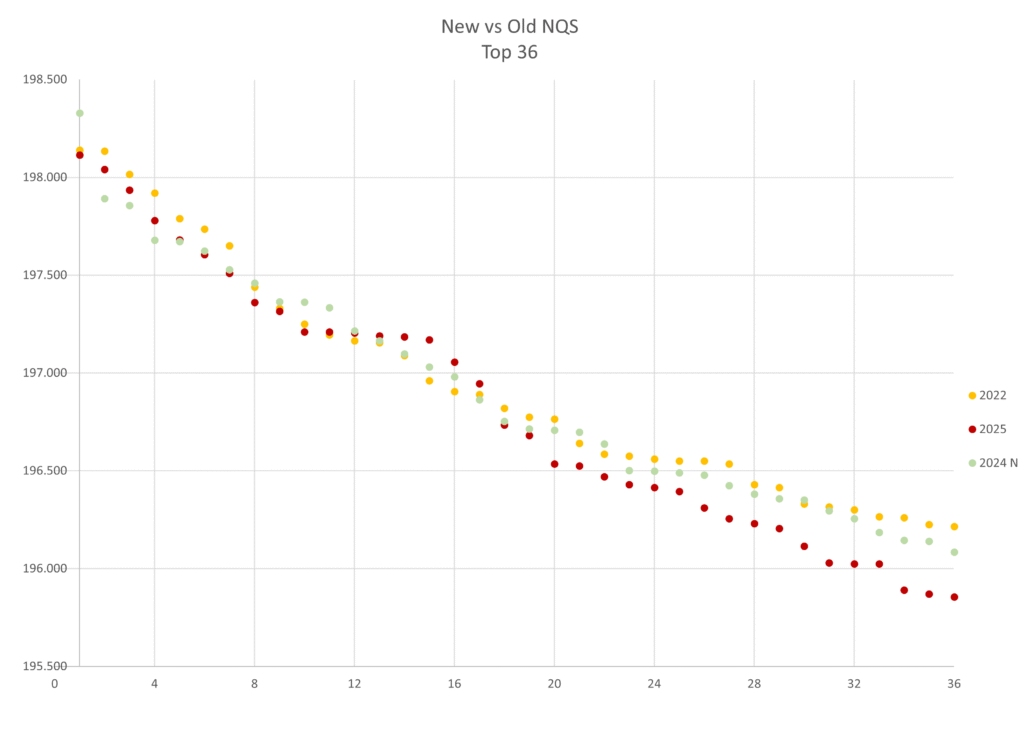
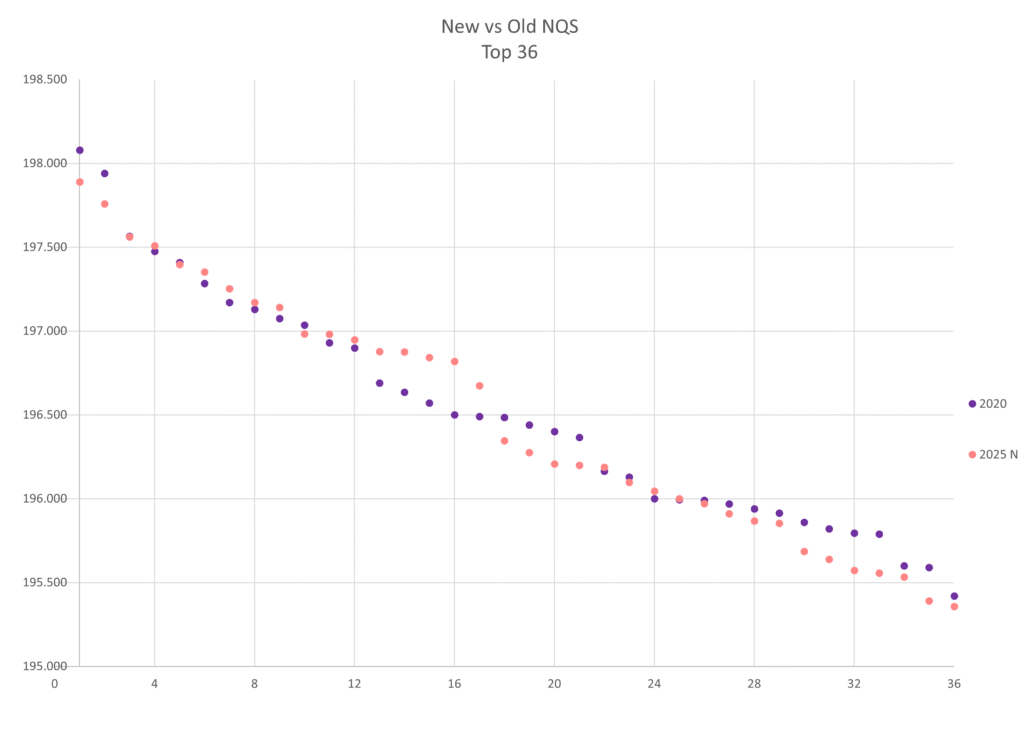
2024 and 2023’s new NQS calculations are also comparable, but 2025’s is lower than the other two, which is also to be expected given the decrease in scores in 2025.
*If you want to look at analysis of past scores, check out my old posts 25 Years of Regionals NQS Requirements, Regionals NQS Requirements: A 2024 Update and Regionals NQS Requirements: A 2025 Update.
In conclusion
So overall, the new NQS system is another step the WCGA and NCAA have taken to reel in the ever-increasing scoring we’ve seen over the last few years. There is a decrease across the board, but we’ll still see the same general ranking of teams as before – with a few exceptions every year.